Exporting and printing a GtkExtra plot canvas
My software package XMI-MSIM relies on GtkExtra for the visualization of the simulated X-ray fluorescence spectra. This library contains a number of useful widgets, such as a spreadsheet widget and a number of plotting tools, for your Gtk2 based GUI’s. Recently, I have become a minor contributor of this project, and I have been particularly active in improving the buildsystem and also generating RPM files for a number of Fedora/RHEL based distros, and DEB files for several recent releases of Ubuntu and Debian. Full instructions on how to obtain access to these packages, which are hosted by my old research group, can be found here.
In todays blog post I am presenting an example of how one can relatively easily add printing and exporting capabilities to GtkExtra’s GtkPlotCanvas widget. I will demonstrate this with a short program that I have written that contains a plot of a sine function, and two buttons that allow the user to invoke the dialog windows that will set up the exporting and the printing of the canvas, respectively.
Generating the interface
Start off with a GtkWindow that contains a GtkVBox, which in turn is packed with two widgets: a GtkHBox that contains three buttons (Print, Save As and Quit), and the GtkPlotCanvas. The code itself is pretty straightforward Gtk+, except for the bit that deals with the GtkPlotCanvas. This is a perhaps a good time to mention that I am in no way a GtkExtra expert (or even Gtk+ for that matter…), and that the following code is the result of my studying of the GtkExtra examples, and the (unfortunately very limited) documentation. Anyway, I’ll try and clarify as much as possible…
Set up the canvas
Define a canvas widget that will be used to draw the plot later and give it dimensions that correspond to those of the A4 paper size standard. Other sizes are also available (letter, executive and legal), and are defined in gtkplotpc.h.The last parameter of the gtk_plot_canvas_new function is the magnification, which acts a scale factor for the dimensions of the canvas, and will therefore determine the size of the widget in the application. However, it has no impact on the size of the print or the size of the exported image.
Next, I disable the user-interaction with the canvas and its items with the call to GTK_PLOT_CANVAS_UNSET_FLAGS, and I define the GdkColors that will be used in the plot and canvas. The last call sets explicitly the background color of the canvas to white.
GtkWidget *canvas = gtk_plot_canvas_new(GTK_PLOT_A4_H, GTK_PLOT_A4_W, 0.8);
gtk_box_pack_start(GTK_BOX(mainbox), canvas, FALSE, FALSE, 2);
GTK_PLOT_CANVAS_UNSET_FLAGS(GTK_PLOT_CANVAS(canvas), GTK_PLOT_CANVAS_CAN_SELECT | GTK_PLOT_CANVAS_CAN_SELECT_ITEM);
gdk_color_parse("white", &white);
gdk_colormap_alloc_color(gdk_colormap_get_system(), &white, FALSE, TRUE);
gdk_color_parse("red", &red);
gdk_colormap_alloc_color(gdk_colormap_get_system(), &red, FALSE, TRUE);
gtk_plot_canvas_set_background(GTK_PLOT_CANVAS(canvas),&white);
Add a plot to the window…
The following calls will generate the plot and set its properties.
Most functionnames should be pretty selfexplanatory, especially when combined with the GtkExtra documentation.
I am not entirely confident about gtk_plot_new_with_size though: at least in this example the two last arguments (width and height), appear to have no influence on the result.
Anyway, after constructing the plot to your liking, it must be added to the GtkPlotCanvas that was defined in the previous section.
This is accomplished with the calls to gtk_plot_canvas_plot_new and gtk_plot_canvas_put_child.
GtkWidget *plot_window;
plot_window = gtk_plot_new_with_size(NULL,.65,.45);
gtk_plot_set_background(GTK_PLOT(plot_window),&white);
gtk_plot_hide_legends(GTK_PLOT(plot_window));

gtk_plot_set_ticks(GTK_PLOT(plot_window), GTK_PLOT_AXIS_X, M_PI_2, 5);
gtk_plot_set_ticks(GTK_PLOT(plot_window), GTK_PLOT_AXIS_Y, 0.2, 5);
gtk_plot_grids_set_visible(GTK_PLOT(plot_window),TRUE ,FALSE, TRUE,FALSE);
gtk_plot_axis_hide_title(gtk_plot_get_axis(GTK_PLOT(plot_window), GTK_PLOT_AXIS_TOP));
gtk_plot_axis_hide_title(gtk_plot_get_axis(GTK_PLOT(plot_window), GTK_PLOT_AXIS_RIGHT));
gtk_plot_axis_set_title(gtk_plot_get_axis(GTK_PLOT(plot_window), GTK_PLOT_AXIS_BOTTOM),"x");
gtk_plot_axis_set_title(gtk_plot_get_axis(GTK_PLOT(plot_window), GTK_PLOT_AXIS_LEFT),"y=sin(x)");
gtk_plot_axis_title_set_attributes(gtk_plot_get_axis(GTK_PLOT(plot_window), GTK_PLOT_AXIS_LEFT),"Helvetica",40,90,NULL,NULL,TRUE,GTK_JUSTIFY_CENTER);
gtk_plot_axis_title_set_attributes(gtk_plot_get_axis(GTK_PLOT(plot_window), GTK_PLOT_AXIS_BOTTOM),"Helvetica",40,0,NULL,NULL,TRUE,GTK_JUSTIFY_CENTER);
gtk_plot_axis_set_labels_attributes(gtk_plot_get_axis(GTK_PLOT(plot_window), GTK_PLOT_AXIS_LEFT),"Helvetica",20,0,NULL,NULL,TRUE,GTK_JUSTIFY_RIGHT);
gtk_plot_axis_set_labels_attributes(gtk_plot_get_axis(GTK_PLOT(plot_window), GTK_PLOT_AXIS_RIGHT),"Helvetica",20,0,NULL,NULL,TRUE,GTK_JUSTIFY_LEFT);
gtk_plot_axis_set_labels_attributes(gtk_plot_get_axis(GTK_PLOT(plot_window), GTK_PLOT_AXIS_BOTTOM),"Helvetica",20,0,NULL,NULL,TRUE,GTK_JUSTIFY_CENTER);
gtk_plot_axis_show_labels(gtk_plot_get_axis(GTK_PLOT(plot_window), GTK_PLOT_AXIS_TOP),0);

GtkPlotCanvasChild *child = gtk_plot_canvas_plot_new(GTK_PLOT(plot_window));
gtk_plot_canvas_put_child(GTK_PLOT_CANVAS(canvas), child, .15,.05,.90,.85);
…and finish off with the data
So far, we have defined the GtkPlotCanvas and the GtkPlot. The latter currently consists of an empty grid. I made things a bit more interesting by adding a graph of a sine function. The following lines calculate 1000 values of the sine function within the interval [0, 4π], and add them subsequently to a GtkPlotData variable, that in turn is added to the GtkPlot with gtk_plot_add_data
As with the grid in the previous section, it is possible to change the properties of the graph using a few appropriately named functions.
This part of the code finishes by drawing and showing all widgets. I am doing this here with several calls, some of which are definitely unnecessary, but the documentation and examples of GtkExtra are pretty unclear on how to do this (especially when updating, erasing canvases, plots etc). Anyway, calling all of them seems to work just fine :-)
//calculate a sine function
double *xvals = g_malloc(sizeof(double)*1000);
double *yvals = g_malloc(sizeof(double)*1000);

int i;

for (i = 0 ; i < 1000 ; i++) {
	xvals[i] = 4*M_PI*i/999;
	yvals[i] = sin(xvals[i]);
}
GtkPlotData *dataset;
dataset = GTK_PLOT_DATA(gtk_plot_data_new());
gtk_plot_add_data(GTK_PLOT(plot_window),dataset);
gtk_plot_data_set_numpoints(dataset, 1000);
gtk_plot_data_set_x(dataset, xvals);
gtk_plot_data_set_y(dataset, yvals);
gtk_plot_set_range(GTK_PLOT(plot_window),0.0, 4*M_PI, -1.0, 1.0);
gtk_plot_clip_data(GTK_PLOT(plot_window), TRUE);
gtk_widget_show(GTK_WIDGET(dataset));
gtk_plot_data_set_line_attributes(dataset,GTK_PLOT_LINE_SOLID,0,0,1,&red);
gtk_plot_canvas_paint(GTK_PLOT_CANVAS(canvas));
gtk_widget_queue_draw(GTK_WIDGET(canvas));
gtk_plot_canvas_refresh(GTK_PLOT_CANVAS(canvas));
gtk_plot_paint(GTK_PLOT(plot_window));
gtk_plot_refresh(GTK_PLOT(plot_window),NULL);

gtk_widget_show_all(window);

gtk_main();
After compilation with something like:
gcc -o gtkextra-print-export `pkg-config --cflags gtkextra-3.0` gtkextra-print-export.c `pkg-config --libs gtkextra-3.0`
and running gtkextra-print-export, you should get something like:
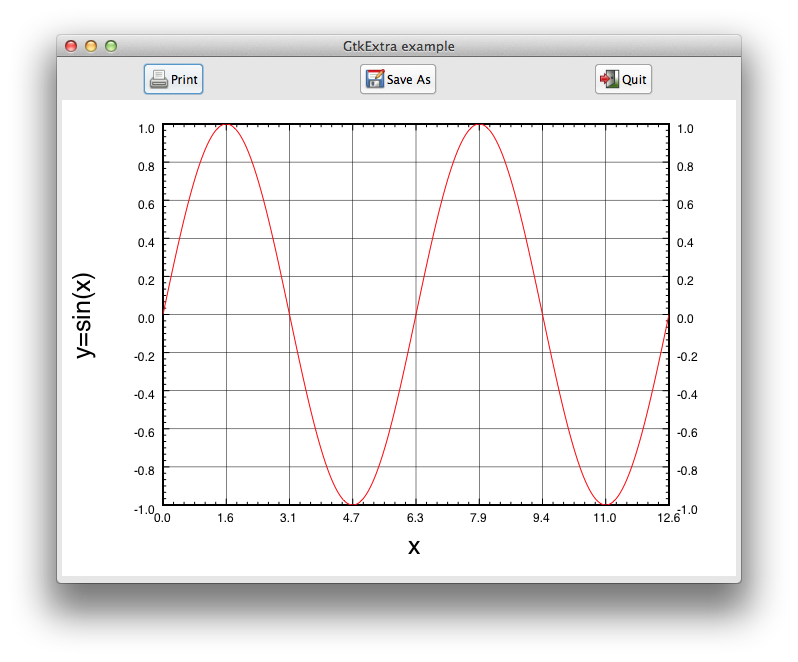
Printing the canvas
Both the printing and exporting of the canvas rely on Cairo. The most important function here is gtk_plot_canvas_export_cairo, which accepts a cairo context as argument and will ‘paint’ the canvas on it. When printing, this cairo context is produced by gtk_print_context_get_cairo_context, as is shown in the following code snippet. It contains both the ‘clicked’ callback for the Print button, as well as the ‘draw-page’ callback for the GtkPrintOperation.
void draw_page(GtkPrintOperation *operation, GtkPrintContext *context, gint page_nr, struct dialogData *dd) {
        cairo_t *cr;

	//the following two lines do all the magic
        cr = gtk_print_context_get_cairo_context(context);
        gtk_plot_canvas_export_cairo(GTK_PLOT_CANVAS(dd->canvas),cr);

        return;
}

void print_button_clicked_cb(GtkWidget *button, struct dialogData *dd) {
	GtkPrintOperation *operation;
        GError *error = NULL;
        GtkPrintOperationResult res;
	GtkPrintSettings *print_settings;
	GtkPageSetup *page_setup;

	//print settings
        print_settings = gtk_print_settings_new();
        gtk_print_settings_set_orientation(print_settings,GTK_PAGE_ORIENTATION_LANDSCAPE);
        gtk_print_settings_set_paper_size(print_settings,gtk_paper_size_new(GTK_PAPER_NAME_A4));
        page_setup = gtk_page_setup_new();
        gtk_page_setup_set_orientation(page_setup,GTK_PAGE_ORIENTATION_LANDSCAPE);
        gtk_page_setup_set_paper_size_and_default_margins(page_setup,gtk_paper_size_new(GTK_PAPER_NAME_A4));

        operation = gtk_print_operation_new();
        gtk_print_operation_set_print_settings(operation,print_settings);
        gtk_print_operation_set_default_page_setup(operation,page_setup);
        gtk_print_operation_set_show_progress(operation,TRUE);
        gtk_print_operation_set_track_print_status(operation, TRUE);
        g_signal_connect(G_OBJECT(operation), "draw-page", G_CALLBACK(draw_page), dd);
        gtk_print_operation_set_n_pages(operation, 1);

        res = gtk_print_operation_run(operation, GTK_PRINT_OPERATION_ACTION_PRINT_DIALOG, GTK_WINDOW(dd->window),&error);

        if (res == GTK_PRINT_OPERATION_RESULT_APPLY) {
                g_object_unref(print_settings);
                print_settings = g_object_ref(gtk_print_operation_get_print_settings(operation));
        }

        g_object_unref(operation);

        return;

}
Exporting the canvas to a file
In this example, I have created the possibility to export to Encapsulated PostScript, PDF and PNG. Cairo also offers SVG support, which may be useful to some. Other fileformats like JPEG may be supported through devIL…
The function in this example is a callback of the Save As button, and pops up a GtkFileChooserDialog, with three GtkFileFilters, each corresponding to one of the supported fileformats. After selecting a filter and choosing the filename, a cairo surface is created for the selected filetype. Next, a cairo context is created for the surface, which will be used to paint the canvas on using gtk_plot_canvas_export_cairo. Multipage formats such as PostScript and PDF require the extra call to cairo_show_page. The function terminates after destroying the cairo surfaces and contexts.
void export_button_clicked_cb(GtkWidget *button, struct dialogData *dd) {
	GtkWidget *dialog;
        GtkFileFilter *filter;
        gchar *filename;
        cairo_t *cr;
        cairo_surface_t *surface;

	dialog = gtk_file_chooser_dialog_new("Export spectra",
                GTK_WINDOW(dd->window), GTK_FILE_CHOOSER_ACTION_SAVE,
                GTK_STOCK_CANCEL, GTK_RESPONSE_CANCEL,
                GTK_STOCK_SAVE, GTK_RESPONSE_ACCEPT, NULL);

	gtk_file_chooser_set_do_overwrite_confirmation (GTK_FILE_CHOOSER (dialog), TRUE);
        filter = gtk_file_filter_new();
        gtk_file_filter_add_pattern(filter,"*.eps");
        gtk_file_filter_set_name(filter,"EPS (Encapsulated PostScript)");
        gtk_file_chooser_add_filter(GTK_FILE_CHOOSER(dialog), filter);
        filter = gtk_file_filter_new();
        gtk_file_filter_add_pattern(filter,"*.pdf");
        gtk_file_filter_set_name(filter,"PDF (Adobe Portable Document Format)");
        gtk_file_chooser_add_filter(GTK_FILE_CHOOSER(dialog), filter);
        filter = gtk_file_filter_new();
        gtk_file_filter_add_pattern(filter,"*.png");
        gtk_file_filter_set_name(filter,"PNG (Portable Network Graphics)");
        gtk_file_chooser_add_filter(GTK_FILE_CHOOSER(dialog), filter);

	if (gtk_dialog_run(GTK_DIALOG(dialog)) == GTK_RESPONSE_ACCEPT) {
                filename = gtk_file_chooser_get_filename(GTK_FILE_CHOOSER(dialog));
                //get selected filter
                filter = gtk_file_chooser_get_filter(GTK_FILE_CHOOSER(dialog));
                if (strncmp(gtk_file_filter_get_name(filter),"EPS", 3) == 0) {
                        if (strcmp(filename+strlen(filename)-4, ".eps") != 0) {
                                filename = (gchar *) g_realloc(filename,sizeof(gchar)*(strlen(filename)+4));
                                strcat(filename,".eps");
                        }
                        surface = cairo_ps_surface_create(filename,842,595);
                        cairo_ps_surface_set_eps(surface,1);
                        cr = cairo_create(surface);

                        gtk_plot_canvas_export_cairo(GTK_PLOT_CANVAS(dd->canvas),cr);
                        cairo_show_page(cr);
                        cairo_surface_destroy(surface);
                        cairo_destroy(cr);

                }
		else if (strncmp(gtk_file_filter_get_name(filter),"PDF", 3) == 0) {
                        if (strcmp(filename+strlen(filename)-4, ".pdf") != 0) {
                                filename = (gchar *) g_realloc(filename,sizeof(gchar)*(strlen(filename)+4));
                                strcat(filename,".pdf");
                        }
                        surface = cairo_pdf_surface_create(filename,842.0,595.0);
                        cr = cairo_create(surface);
                        gtk_plot_canvas_export_cairo(GTK_PLOT_CANVAS(dd->canvas),cr);
                        cairo_show_page(cr);
                        cairo_surface_destroy(surface);
                        cairo_destroy(cr);
                }
                else if (strncmp(gtk_file_filter_get_name(filter),"PNG", 3) == 0) {
                        if (strcmp(filename+strlen(filename)-4, ".png") != 0) {
                                filename = (gchar *) g_realloc(filename,sizeof(gchar)*(strlen(filename)+4));
                                strcat(filename,".png");
                        }
                        surface = cairo_image_surface_create(CAIRO_FORMAT_ARGB32, 842, 595);
                        cr = cairo_create(surface);
                        gtk_plot_canvas_export_cairo(GTK_PLOT_CANVAS(dd->canvas),cr);
                        cairo_surface_write_to_png(surface,filename);
                        cairo_surface_destroy(surface);
                        cairo_destroy(cr);
                }
                g_free(filename);
                gtk_widget_destroy(dialog);
	}
	else
                gtk_widget_destroy(dialog);


        return;

}
The code
This is the full code: feel free to hack away at it. It is taken from xmimsim-gui-results.c, which contains a lot more GtkExtra related code: drawing lines, changing graph properties, hiding data etc. Keep in mind that up to today, GtkExtra is still only compatible with Gtk2. However, the developers are actively working on providing Gtk3 support as well. Any help in accomplishing this transition would be greatly appreciated!