Embedding PLplot in Gtk DrawingAreas
Update: I have turned this post into a Github project called Gtkmm-PLplot, under the GPLv3
Scientific plotting and Gtk+ have never been good friends. Over the years there have been a number of efforts like GtkExtra, GtkDataBox, GoatPlot, GtkGraph… Unfortunately these packages all appear to share a lack of active development (most are in fact abandoned), poor to non-existent documentation and in most cases lack of support for Gtk+3.
For about a year or two I have been a minor contributor to GtkExtra, and I had started migrating the plotting widgets to Gtk+3 but I had to abandon my effort due to lack of knowledge of Cairo and Gtk+ internals, and more importantly a lack of time. I still use it in the Gtk+2 based GUI of my XMI-MSIM package though.
I have recently been looking into alternatives to GtkExtra as I switched to Gtk+3 (actually Gtkmm3, as I mostly code in C++ nowadays) for my new projects (e.g. BAM-utils). I came across a package called PLplot, which I used a long time ago for producing simple plots in PNG format in command-line utilities.
This package used to come with Gnome bindings that ensured easy integration into Gnome based GUIs but it looks like they have been removed some time ago (I am referring here to PLplot 5.11.0, the current stable release). Instead the documentation mentions support for a cairo driver, which can be embedded in Gtk based user interfaces. Currently the documentation that covers this feature is limited to a README file and a minimal cairo-only example that demonstrates how to use the PLplot cairo driver through the extcairo device by producing a PostScript file.
PLplot has the great advantage over the aforementioned Gtk+ based packages that it is very actively developed by several volunteers and comes with decent documentation, including a lot of examples written in the many languages supported by the toolkit. On the downside, the developers seem to have the unfortunate habit of regularly breaking backwards compatibility in their releases, as they did in their latest 5.11.0 release both at the API level as well as by changing the name of the pkg-config packages…
In this blogpost I will explain how I managed to embed PLplot into Gtkmm through the GtkDrawingArea widget class, and demonstrate it using a small program that allows one to zoom in on the data, save the plot in a file and print it.
Compiling PLplot on Windows 64-bit using TDM-GCC
It would be remiss if I didn’t share the problems I encountered compiling PLplot on my Windows 7 64-bit virtual machine using the TDM-GCC provided MinGW-w64 5.1.0 gcc and g++ compilers. I used the following command to setup the CMake based installation system:
cmake -G "MSYS Makefiles" -DENABLE_DYNDRIVERS=OFF -DPLD_wingcc=OFF ..The DYNDRIVERS option determines whether the drivers will be loaded at runtime using the libtool ltdl interface, or if they will be built into the main shared library. I chose the latter as this makes distribution easier (less files to copy and no need to set a environment variable or use the registry to get the locations of these drivers). Also I had a feeling PLplot has not been well-tested on Windows, so I prefer avoiding something potentially dangerous as loading dynamically loading modules using libltdl, a library I have no experience with.
I turned of the wingcc driver well simply because the linker consistently crashed when generating the dll. Again something that does not lead me to exude confidence regarding stability of PLplot on Windows 64-bit, but this could also have to do with the immature nature of MinGW-w64. Fortunately I don’t need this driver so no great loss here…
The cmake invokation generated the necessary Makefiles, and I started the compilation using a good old fashioned make.
I noticed that a compilation error was generated in drivers/cairo.c, which I managed to fix after some work with the following patch:
diff --git a/drivers/cairo.c b/drivers/cairo.c
index 8d43ee9..91fbc7d 100644
--- a/drivers/cairo.c
+++ b/drivers/cairo.c
@@ -43,6 +43,7 @@
 // Driver-dependent includes
 #if defined ( PLD_wincairo )
 #include <windows.h>
+#include <cairo-win32.h>
 #endif
 #if defined ( PLD_xcairo )
 #include <cairo-xlib.h>
@@ -3289,7 +3290,7 @@ LRESULT CALLBACK PlplotCairoWndProc( HWND hwnd, UINT nMsg, WPARAM wParam, LPARAM
     }
     else
     {
-        pls = (PLStream *) GetWindowLong( hwnd, GWL_USERDATA ); // Try to get the address to pls for this window
+        pls = (PLStream *) GetWindowLongPtr( hwnd, GWLP_USERDATA ); // Try to get the address to pls for this window
         if ( pls )                                              // If we got it, then we will initialise this windows plplot private data area
         {
             dev = (PLCairo *) pls->dev;
@@ -3496,7 +3497,7 @@ void plD_init_wincairo( PLStream *pls )
 // process this window
 //

-    SetWindowLong( aStream->hwnd, GWL_USERDATA, (long) pls );
+    SetWindowLongPtr( aStream->hwnd, GWLP_USERDATA, (LONG_PTR) pls );
     aStream->SCRN_hdc = aStream->hdc = GetDC( aStream->hwnd );

 //
This patch clearly shows that the developers have never tried compiling PLplot with a 64-bit compiler on Windows, neither with gcc nor Visual Studio, as they would have run into the same issue: GWL_USERDATA is simply not defined for 64-bit compilations, and GetWindowLong/SetWindowLong have been superseded by GetWindowLongPtr/SetWindowLongPtr.
Either way, I submitted this patch upstream and I hope that it will be included in the next release (already merged into the master branch).
Obviously no problems arised while compiling PLplot on my Mac and I expect the same for Linux.
Setting up the build environment
As usual in my projects, I chose to use the GNU buildtools for my build environment, which in this case consisted of a simple configure.ac and Makefile.am. The former checks that we have a suitable C++ compiler with C++11 standard support as well as the GNU extensions. For this I am using the latest version of the autoconf macro called ax_cxx_compile_stdcxx_11.m4, which I downloaded from the autoconf archive.
Next I check for the presence of Gtkmm (version 3!) and PLplot. I took care to provide support for both the old and new name of the PLplot C++ bindings, respectively called plplotd-c++ and plplot-c++. Using the compilation test provided by the autoconf macro AC_TRY_COMPILE I test for the presence of the extcairo device that I will be using to connect a Cairo context with the PLplot plotting stream.
The PLplotDrawingArea class
Moving on to the interesting part: the definition of our class. Obviously we want it to be derived from Gtkmm’s DrawingArea class. Instances of this class are basically blank widgets for which the user is required to override the default handler on_draw for the signal signal_draw, as is covered in the reference manual of both Gtk and Gtkmm.
The class definition follows in the following excerpt. I will discussing the different methods in the following sections.
#ifndef PLPLOTDRAWINGAREA_H
#define PLPLOTDRAWINGAREA_H

#include <gtkmm/drawingarea.h>
#include <plstream.h>
#include <string>
#include <vector>

typedef sigc::signal<void, double, double, double, double > type_signal_select_region;

class PLplotDrawingArea : public Gtk::DrawingArea {
private:
  std::vector<PLFLT> x;
  std::vector<PLFLT> y;
  std::string x_title;
  std::string y_title;
  std::string plot_title;
  double start_event[2];
  double start_cairo[2];
  double end_event[2];
  double end_cairo[2];
  bool selecting;
  plstream *pls;
  double x_pl_range[2];
  double y_pl_range[2];
  double x_cr_range[2];
  double y_cr_range[2];
protected:
  //our handler for the on_draw signal
  virtual bool on_draw(const Cairo::RefPtr<Cairo::Context>& cr);
  // This is the default handler for the signal signal_select_region().
  virtual void on_select_region(double xmin, double xmax, double ymin, double ymax);
  bool on_button_press_event(GdkEventButton *event);
  bool on_button_release_event(GdkEventButton *event);
  bool on_motion_notify_event (GdkEventMotion *event);
  type_signal_select_region _signal_select_region;

public:
  PLplotDrawingArea(
    const std::vector<PLFLT> &x,
    const std::vector<PLFLT> &y,
    const std::string &x_title,
    const std::string &y_title,
    const std::string &plot_title
  );
  void convert_plplot_to_cairo_coordinates(
    double x_pl, double y_pl,
    double &x_cr, double &y_cr);
  virtual ~PLplotDrawingArea() {
    if (pls)
      delete pls;
  }

  type_signal_select_region signal_select_region() {
    return _signal_select_region;
  }

  void set_region(double xmin, double xmax, double ymin, double ymax);

  void draw_plot(const Cairo::RefPtr<Cairo::Context> &cr, plstream *_pls, int width, int height);
};
#endif
The constructor
Let’s start of with the constructor of the class. In this simple example I will assume that user wants to produce a simple two-dimensional plot defined by a vector of X-values and one of Y-values.Obviously our widget class has the potential of being used for far more complex plots after some re-writing and extending but is outside the scope of this blogpost. The code:
PLplotDrawingArea::PLplotDrawingArea(
  const std::vector<PLFLT> &_x,
  const std::vector<PLFLT> &_y,
  const std::string &_x_title,
  const std::string &_y_title,
  const std::string &_plot_title
) : x(_x),
    y(_y),
    x_title(_x_title),
    y_title(_y_title),
    plot_title(_plot_title),
    start_event{-1.0, -1.0},
    start_cairo{-1.0, -1.0},
    end_event{-1.0, -1.0},
    end_cairo{-1.0, -1.0},
    selecting(false),
    pls(0),
    x_pl_range{*(x.begin()), *(x.end()-1)},
    y_pl_range{*std::min_element(y.begin(), y.end()),
               *std::max_element(y.begin(), y.end())}
     {
  add_events(Gdk::POINTER_MOTION_MASK |
             Gdk::BUTTON_PRESS_MASK |
             Gdk::BUTTON_RELEASE_MASK);

  //connect our default signal handler
  this->signal_select_region().connect(sigc::mem_fun(*this,
             &PLplotDrawingArea::on_select_region));
}
Our input vectors are referred to here as _x and _y in the argument list. Furthermore, the user is expected to provide axes titles and a general plot title. The initialization list shows that we will be using member variable copies of these 5 arguments. Note that I am using the PLplot PLFLT datatype here for the vectors, which is typedef’ed to the double datatype.
The rest of the list deals with private variables that deal with the selection box (start_event, start_cairo, end_event, end_cairo and selecting), our PLplot stream object pls and the plotting range determined by x_pl_range and y_pl_range, which are initially set to cover the entire area provided by the data.
The method body does only two things: it makes sure that the mouse events necessary to drag the selection box will be emitted as signals.
Our class defines one signal called signal_on_select_region (after the similarly named GtkPlotCanvas signal from GtkExtra). This signal will be emitted whenever a selection box has been dragged. Its default handler is the on_select_region virtual method, which does absolutely nothing!
So it is up to the user to either derive PLplotDrawing area with an overriding on_select_region method, or alternatively to connect to this signal as will be shown later on in this example. A perfect candidate (with the right function prototype) for this task is the set_region method, which will reduce the plot range to the selected box. This will be demonstrated further along this example when we will be discussing the Window that will hold our PLplotDrawingArea.
The on_draw method
The on_draw method will be the most important one of our class as it needs to call the PLplot routines to generate our plot. Let’s have a closer look at it:
bool PLplotDrawingArea::on_draw(const Cairo::RefPtr<Cairo::Context>& cr) {
  Gtk::Allocation allocation = get_allocation();
  const int width = allocation.get_width();
  const int height = allocation.get_height();

  if (pls)
    delete pls;
  pls = new plstream;

  draw_plot(cr, pls, width, height);

  if (selecting &&
      start_cairo[0] >= 0.0 &&
      start_cairo[1] >= 0.0 &&
      end_cairo[0] >= 0.0 &&
      end_cairo[1] >= 0.0) {
    cr->set_line_width(2);
    cr->set_source_rgb(0, 0, 0);
    cr->rectangle(MIN(start_cairo[0], end_cairo[0]),
                  MIN(start_cairo[1], end_cairo[1]),
                  fabs(end_cairo[0] - start_cairo[0]),
                  fabs(end_cairo[1] - start_cairo[1]));
    cr->stroke();
  }

  convert_plplot_to_cairo_coordinates(x_pl_range[0], y_pl_range[0],
                                      x_cr_range[0], y_cr_range[0]);
  convert_plplot_to_cairo_coordinates(x_pl_range[1], y_pl_range[1],
                                      x_cr_range[1], y_cr_range[1]);
  return true;
}
The method provides as input argument a pointer to the Cairo context that we will draw to.
We start by querying the dimensions of the widget, followed by allocating memory for our PLplot stream pls, which will next be provided to a method called draw_plot that will take care of the actual PLplot commands:
void PLplotDrawingArea::draw_plot(const Cairo::RefPtr<Cairo::Context> &cr, plstream *_pls, int width, int height) {
  _pls->sdev("extcairo");
  _pls->spage(0.0, 0.0, width, height, 0, 0);
  _pls->init();

  Gdk::RGBA color = get_style_context()->get_color();
  Gdk::Cairo::set_source_rgba(cr, color);
  _pls->cmd(PLESC_DEVINIT, cr->cobj());
  _pls->col0(0);

  _pls->env(x_pl_range[0], x_pl_range[1],
            y_pl_range[0], y_pl_range[1],
            0, 0);

  _pls->lab(x_title.c_str(), y_title.c_str(), plot_title.c_str());
  _pls->col0(1);
  _pls->line(x.size(), &x[0], &y[0]);

  return;
}
The main reason I am not including this code in on_draw is that gives me the possibility to apply it to Cairo contexts that are not connected to Gtk widgets, but instead to Cairo surfaces for PostScript, PNG and PDF backends as I will demonstrate later on.
Let’s go through the different PLplot commands. Their calling order is very important.
_pls->sdev("extcairo"): ensures that our stream will be using theextcairodevice. This entire class hinges on the availability of this device._pls->spage(0.0, 0.0, width, height, 0, 0): sets the dimensions of the total plotting area (including axes titles etc.!) available to PLplot equal to the widget dimensions._pls->init(): initialize the plstream. PLplot internal housekeeping._pls->cmd(PLESC_DEVINIT, cr->cobj()): connects the PLplot internals to our Cairo context. Note the call tocobj():cris a Cairomm object andcmdexpects a plain Cairo context pointer._pls->col0(0): sets the current color to the first entry in the default colortable: black_pls->env(...): defines the range of our X- and Y-data that will be plotted. By default equal to the entire data-range but may be changed when properly handled withsignal_select_regionandset_region. The last argument determines the axes types._pls->lab(...): sets the axes and plot labels._pls->col0(1): switch to the second color of the colortable: red._pls->line(x.size(), &x[0], &y[0]): plot the graph
That’s it! For more information about the commands, check the extensive PLplot documentation.
Back to on_draw: after the call to draw_plot we find some code that will draw the selection box (if necessary) using some basic Cairo commands. The last two lines are calls to convert_plplot_to_cairo_coordinates, which provide the box selection code with the Cairo coordinates of the plot grid, and will be used to constrain the selection box to the plot grid. These function needs to be called in every call to on_draw as it is the only way to take into account window resizing.
Dragging the selection box
An important feature typically found in plotting toolkits is the ability to drag selection boxes. This could be used for example for zooming in on a particular range of the data or for selecting items such as labels that could then be moved around or deleted. To implement this feature one needs to connect signal handlers to signals emitted when a mouse button is pressed and released, as well as when the mouse pointer is moved around. This is why the class contains the three methods on_button_press_event, on_button_release_event and on_motion_notify_event. In order to ensure that the corresponding signals are emitted, the events were added to newly created instances of our class in the constructor.
The hardest part when writing these methods is dealing with the different coordinate systems involved, which can be explained as follows:
- The Gdk events provide widget coordinates with a coordinate system with an origin in the top left corner of the widget.
- Cairo on the other hand works with a coordinate system that has an origin in the lower left corner.
- Using the widget height and width, these can be easily translated to normalized coordinates.
- To determine the corresponding PLplot coordinates inside our data grid, we feed the normalized Cairo coordinates to PLplot’s
calc_worldfunction.
Using this information we can then properly set up our methods that deal with the mouse events.
Basically, while the mouse button is pressed in and the cursor is moved around, a selection box will be shown (look at the call to rectangle in on_draw), that will be constrained to the data grid, by setting appropriate limits to the drawing starting point and dimensions of our box. Furthermore, we do not allow the box to be drawn when the the button press event is outside of this box.
When the mouse button is released, the box is removed from the widget but the signal_select_region is emitted with the PLplot coordinates of the press and release events, resulting in a call to on_select_region.
Testing our PLplotDrawingArea widget
In order to demonstrate the capabilities of this widget, I have written a very basic program that tries to emulate my example from my previous post on GtkExtra printing and exporting. However, I have added two extra capabilities: the possibility to zoom in with the selection box and window resizing.
The test program is an instance of my class called PLplotWindow, which in turn derives from Gtk::Window, and contains only a few member variables corresponding to the buttons and our PLplot drawing area, as well as a Gtk::Grid instance to organize them into the window.
Several methods were added to handle the button click signals that allow to export and print the plot, as well as to quit the app. The code to print and export the plot is basically a literal translation of the corresponding functions in my GtkExtra post from C to C++ and will not be covered here.
More interestingly is the on_plplot_drawing_area_double_click method, which deals with a problem we have not addressed so far: after zooming in on the plot, what if we want to see to the full data range again? I had not added a method for this to our PLplotDrawingArea class (though I could have), so we have to address this issue here. This simple method consists of the following:
bool PLplotWindow::on_plplot_drawing_area_double_click(GdkEventButton *event,
  double xmin, double xmax, double ymin, double ymax) {
  if (event->type == GDK_2BUTTON_PRESS) {
    plplot_drawing_area.set_region(xmin, xmax, ymin, ymax);
  }
  return false;
}
Since the libsigc++ slot prototype for signal_button_press_event does not provide these 4 double variables, we have to provide them when we connect the signal to our handler using sigc::bind in the constructor:
  plplot_drawing_area.signal_button_press_event().connect(
      sigc::bind(sigc::mem_fun(*this, &PLplotWindow::on_plplot_drawing_area_double_click),
      *(x.begin()), *(x.end()-1), *std::min_element(y.begin(), y.end()), *std::max_element(y.begin(), y.end())));
The constructor also contains our signal handler for PLplotDrawingArea’s signal_select_region:
  plplot_drawing_area.signal_select_region().connect(
     sigc::mem_fun(plplot_drawing_area, &PLplotDrawingArea::set_region));
As stated before, we simply make use of our set_region method here which takes care of everything.
One last thing I feel is worth showing here is the following excerpt from the constructor:
set_default_size(720, 580);
Gdk::Geometry geometry;
geometry.min_aspect = geometry.max_aspect = double(720)/double(580);
set_geometry_hints(*this, geometry, Gdk::HINT_ASPECT);
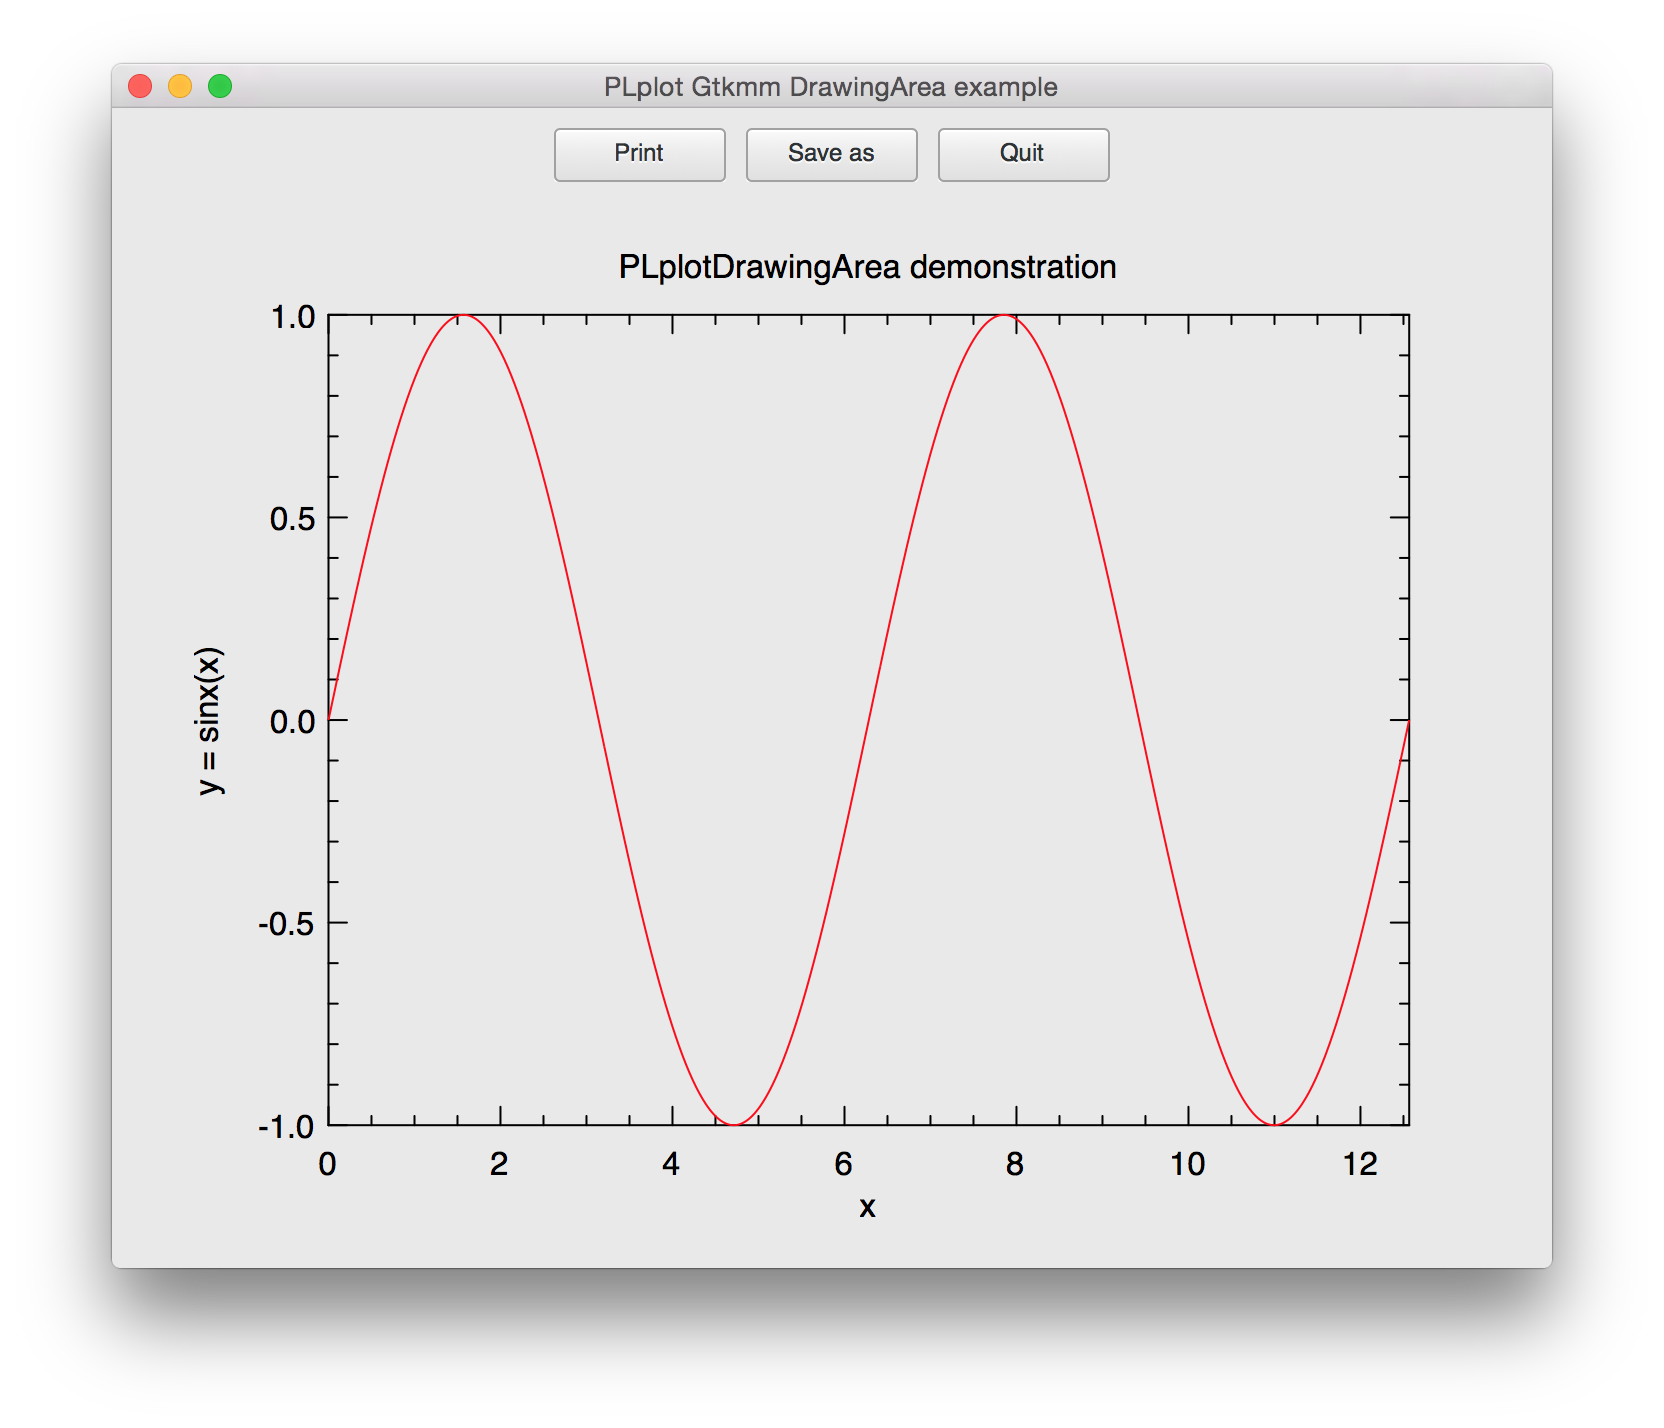
set_title("PLplot Gtkmm DrawingArea example")
plplot_drawing_area.set_hexpand(true);
plplot_drawing_area.set_vexpand(true);This part ensures that no matter how the window is resized, the aspect ratio is set to 720/580.
For this to work properly it is crucial that the drawing area is allowed to expand in both directions. Upon a resize, the plot will then be updated accordingly by the on_draw method.
I will conclude this section with a screenshot of the graphical user interface:
Feel free to try it for yourself using the following steps:
- git clone git@gist.github.com:/c40bb9cca6719478f000.git plplot-test
- cd plplot-test
- autoreconf -i
- ./configure
- make
- ./plplot-test
- That’s it! Start fooling around with the selection box and resizing…
The full gist follows after the conclusions.
Conclusions
Based on the work I have put into this for the last couple of days I would say it is a very promising method of bringing high quality scientific plotting into Gtk/Gtkmm. Obviously the code I shared is very simple and needs a lot more functionality in order to become truly useful for a large audience. However the main problem is finding the time to write all the required methods that wrap the functions of PLplot that are needed, which is not necessarily a hard thing to do. Ideally, this would be done in Gtk+ instead of Gtkmm as it would open the code to usage from all languages that have bindings to Gtk+ through introspection. Extending classes in Gtk+ is really hard though (which is why almost no one does it), but trivial in Gtkmm…
Anyway, if I ever decide to turn this into a real library, you will read about it here.