A Prometheus exporter for monitoring Guacamole remote desktop gateway instances
One of the first tasks I worked on after joining the Rosalind Franklin Institute was setting up an Apache Guacamole Clientless Remote Desktop Gateway for our staff: through their webbrowsers, my colleagues are now able to access virtual machines that have been spun up on Openstack and AWS EC2, which come preloaded with the tools they need to analyze and process their data.
To monitor all the services that we deployed at the Franklin, I have set up an instance with Grafana and Prometheus, while installing Prometheus’ node exporter on all virtual machines of interest. Combined with Alertmanager, we are now automatically alerted through email and messages in Microsoft Teams whenever a virtual machine goes down, is about to run out of diskspace etc.
While this approach also offers valuable insights such as CPU and memory usage of the virtual machine that hosts the Guacamole instance, it doesn’t give any straightforward answers to how many connections it currently provides, or a historic overview thereof: such information could be useful for possible future auditing.
Regrettably, Guacamole currently does not support exporting these metrics in a manner that allows them to be used as a datasource by Grafana or even scraped by Prometheus. All that is currently offered by Guacamole is a REST API that allows users with admin privileges to manage connections and users as well get historic or current information about them.
After reading up on how to develop your own Prometheus exporters, I decided to explore this REST API and see if it could be for my desired purposes. The Prometheus team maintains client libraries for Go, Java, Python and Ruby, and similar third-party libraries are available for a dozen more languages: such a library needs to be included in your exporter to define and expose internal metrics via an HTTP endpoint on your application’s instance to ensure these metrics may be scraped by the Prometheus instance.
Having seen a lot of these exporters on GitHub, it is clear that the cool kids nowadays are primarily using Go to write these exporters. As I never really managed to stand up to peer pressure, I decided to learn a bit of Go, a language I was previously unfamiliar with, and after studying a similar project, I managed to come up with a working Guacamole Exporter after just an hour or two of work.
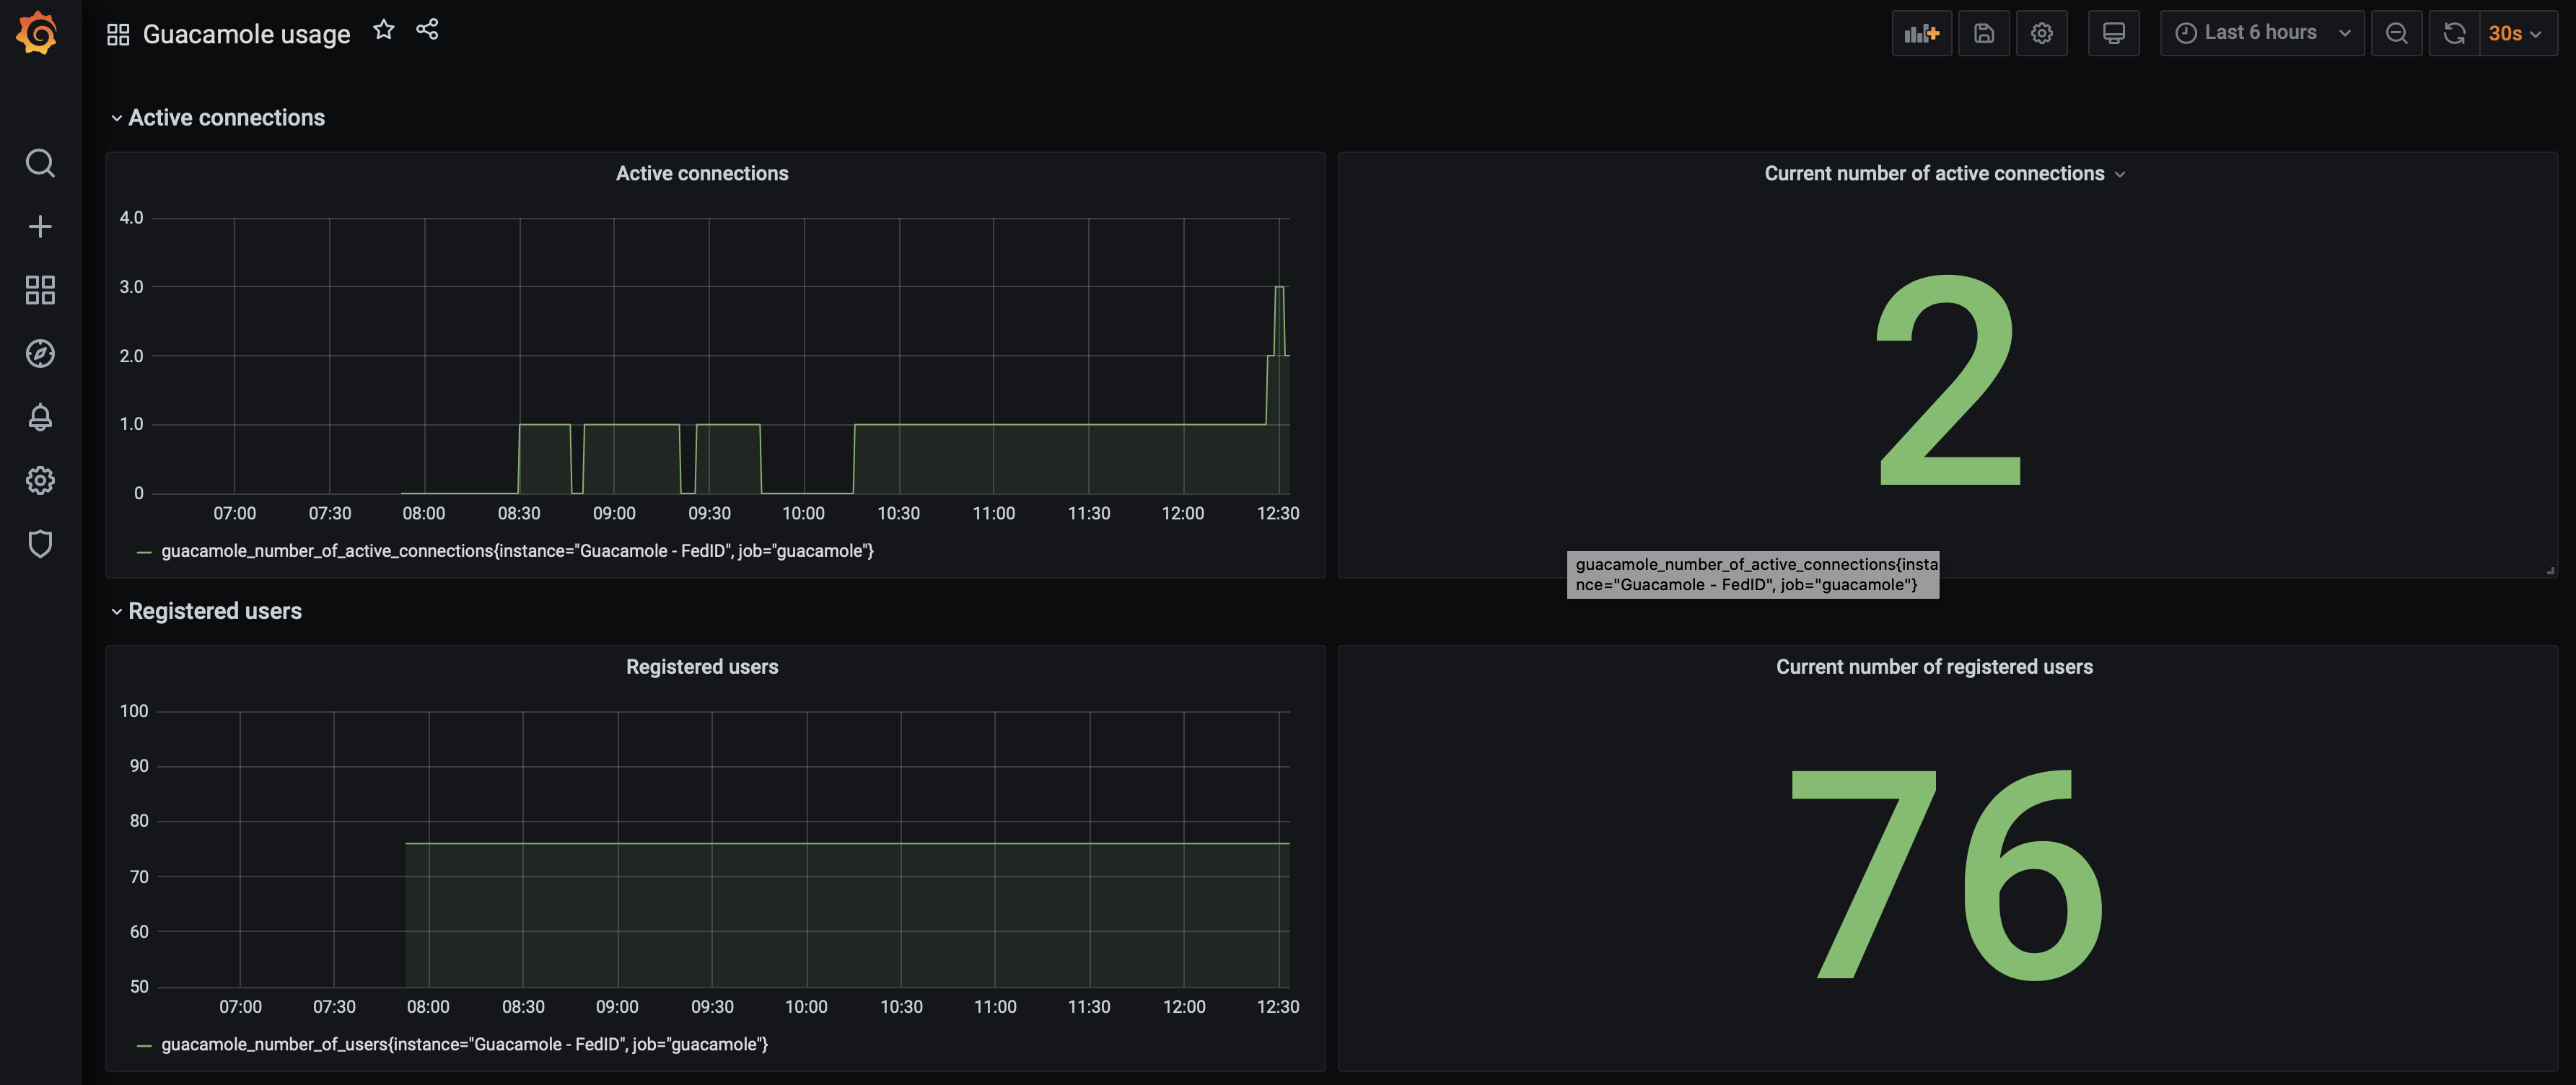
The code is hosted on Github, and in the releases section you will find binaries for Linux (amd64/arm64), macOS and Windows, as well as an example Grafana dashboard that is suitable for this exporter. Docker images are also available, for a variety of architectures.
To facilitate installation onto our systems, I came up with an Ansible role (my first Ansible Galaxy role!), inspired by the Cloudalchemy roles, which I would strongly recommend to anyone who considers deploying their own Grafana/Prometheus/Alertmanager/node-exporter setup.
The exporter currently has limited functionality, and I am certain that there a number of metric that can be added to increase usefulness. Feel free to tell me about it (or contribute them yourself!): if supported by the Guacamole REST API, it shouldn’t be hard to add them.