|
| | Plot3D (PlotData3D &data, const Glib::ustring &axis_title_x="X-axis", const Glib::ustring &axis_title_y="Y-axis", const Glib::ustring &axis_title_z="Z-axis", const Glib::ustring &plot_title="", const double plot_width_norm=1.0, const double plot_height_norm=1.0, const double plot_offset_horizontal_norm=0.0, const double plot_offset_vertical_norm=0.0) |
| |
| virtual | ~Plot3D () |
| |
| void | set_altitude (double altitude) |
| |
| double | get_altitude () |
| |
| void | set_azimuth (double azimuth) |
| |
| double | get_azimuth () |
| |
| virtual void | add_data (PlotData3D &data) |
| |
| virtual void | draw_plot (const Cairo::RefPtr< Cairo::Context > &cr, const int width, const int height) override |
| |
| virtual | ~Plot () |
| |
| virtual void | remove_data (unsigned int plot_data_index) |
| |
| virtual void | remove_data (PlotData &plot_data_member) |
| |
| virtual void | remove_object (unsigned int plot_object_index) |
| |
| virtual void | remove_object (PlotObject &plot_object_member) |
| |
| virtual PlotData * | get_data (unsigned int data_index=0) final |
| |
| void | set_axis_title_x (Glib::ustring title) |
| |
| void | set_axis_title_y (Glib::ustring title) |
| |
| Glib::ustring | get_axis_title_x () |
| |
| Glib::ustring | get_axis_title_y () |
| |
| void | set_plot_title (Glib::ustring title) |
| |
| Glib::ustring | get_plot_title () |
| |
| void | show () |
| |
| void | hide () |
| |
| bool | is_showing () const |
| |
| Gdk::RGBA | get_background_color () |
| |
| void | set_background_color (Gdk::RGBA color) |
| |
| Gdk::RGBA | get_axes_color () |
| |
| void | set_axes_color (Gdk::RGBA color) |
| |
| Gdk::RGBA | get_titles_color () |
| |
| void | set_titles_color (Gdk::RGBA color) |
| |
| sigc::signal< void(void)> | signal_changed () |
| |
| sigc::signal< void(PlotData *)> | signal_data_added () |
| |
| sigc::signal< void(PlotData *)> | signal_data_removed () |
| |
| sigc::signal< void(PlotObject *)> | signal_object_added () |
| |
| sigc::signal< void(PlotObject *)> | signal_object_removed () |
| |
| virtual void | set_manage () |
| |
| void | set_legend_background_color (Gdk::RGBA legend_background_color) |
| |
| Gdk::RGBA | get_legend_background_color () |
| |
| void | set_legend_bounding_box_color (Gdk::RGBA legend_bounding_box_color) |
| |
| Gdk::RGBA | get_legend_bounding_box_color () |
| |
| void | set_legend_position (double legend_pos_x, double legend_pos_y) |
| |
| void | get_legend_position (double &legend_pos_x, double &legend_pos_y) |
| |
| void | set_legend_corner_position (LegendCornerPosition legend_corner_position) |
| |
| LegendCornerPosition | get_legend_corner_position () |
| |
| void | show_legend () |
| |
| void | hide_legend () |
| |
| bool | is_showing_legend () |
| |
|
| virtual void | plot_data_modified () override |
| | a method that will update the _range variables when datasets are added, modified or removed.
|
| |
| | Plot3D (const Glib::ustring &axis_title_x, const Glib::ustring &axis_title_y, const Glib::ustring &axis_title_z, const Glib::ustring &plot_title, const double plot_width_norm, const double plot_height_norm, const double plot_offset_horizontal_norm, const double plot_offset_vertical_norm) |
| |
| virtual void | on_changed () |
| |
| virtual void | on_data_added (PlotData *new_data) |
| |
| virtual void | on_data_removed (PlotData *removed_data) |
| |
| virtual void | on_object_added (PlotObject *new_object) |
| |
| virtual void | on_object_removed (PlotObject *removed_object) |
| |
| virtual void | draw_plot_init (const Cairo::RefPtr< Cairo::Context > &cr, const int width, const int height) final |
| |
| | Plot (const Glib::ustring &axis_title_x, const Glib::ustring &axis_title_y, const Glib::ustring &plot_title, const double plot_width_norm, const double plot_height_norm, const double plot_offset_horizontal_norm, const double plot_offset_vertical_norm) |
| |
| | Object () |
| |
| | Legend (const Legend &legend)=default |
| |
| | Legend (LegendCornerPosition legend_corner_position=LegendCornerPosition::TOP_RIGHT, double legend_pos_x=0.0, double legend_pos_y=0.0, Gdk::RGBA legend_background_color=Gdk::RGBA("White"), Gdk::RGBA legend_bounding_box_color=Gdk::RGBA("Black")) |
| |
| virtual | ~Legend () |
| |
| virtual void | draw_legend (const Cairo::RefPtr< Cairo::Context > &cr, std::vector< PlotData * > &plot_data, plstream *pls) |
| |
|
| std::vector< PlotData * > | plot_data |
| | vector that contains pointers to the PlotData datasets
|
| |
| std::vector< PlotObject * > | plot_objects |
| | vector that contains pointers to the PlotObject datasets
|
| |
| Glib::ustring | axis_title_x |
| | X-axis title.
|
| |
| Glib::ustring | axis_title_y |
| | Y-axis title.
|
| |
| Glib::ustring | plot_title |
| | Plot title.
|
| |
| plstream * | pls |
| | the plstream object that will ensure the connection with PLplot
|
| |
| int | canvas_width |
| | the width of the canvas in Cairo units
|
| |
| int | canvas_height |
| | the height of the canvas in Cairo units
|
| |
| int | plot_offset_x |
| | the offset of the plot with respect to the top left corner of the canvas, measured along the horizontal (X-) axis in Cairo units
|
| |
| int | plot_offset_y |
| | the offset of the plot with respect to the top left corner of the canvas, measured along the vertical (Y-) axis in Cairo units
|
| |
| int | plot_width |
| | the current width of the plot in Cairo units
|
| |
| int | plot_height |
| | the current height of the plot in Cairo units
|
| |
| bool | shown |
| | true means the plot is currently visible, false means it is not plotted
|
| |
| Gdk::RGBA | background_color |
| | the currently used background color of the plot (default = fully transparent white, meaning that the background will be determined by the canvas)
|
| |
| const double | plot_width_norm |
| | the normalized plot width, calculated relative to the canvas width
|
| |
| const double | plot_height_norm |
| | the normalized plot height, calculated relative to the canvas height
|
| |
| const double | plot_offset_horizontal_norm |
| | the normalized horizontal offset from the canvas top left corner, calculated relative to the canvas width
|
| |
| const double | plot_offset_vertical_norm |
| | the normalized vertical offset from the canvas top left corner, calculated relative to the canvas height
|
| |
| Gdk::RGBA | axes_color |
| | the currently used color to draw the axes, the box and gridlines. Default is opaque black
|
| |
| Gdk::RGBA | titles_color |
| | the currently used color to draw the axes and plot titles. Default is opaque black
|
| |
| sigc::signal< void(void)> | _signal_changed |
| | signal that gets emitted whenever any of the plot parameters, or any of the contained PlotData datasets is changed.
|
| |
| sigc::signal< void(PlotData *)> | _signal_data_added |
| | signal emitted whenever a PlotData dataset is added to the plot
|
| |
| sigc::signal< void(PlotData *)> | _signal_data_removed |
| | signal emitted whenever data is removed from the plot.
|
| |
| sigc::signal< void(PlotObject *)> | _signal_object_added |
| | signal emitted whenever a PlotObject is added to the plot
|
| |
| sigc::signal< void(PlotObject *)> | _signal_object_removed |
| | signal emitted whenever a PlotObject is removed from the plot.
|
| |
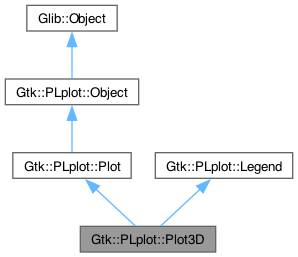
a class for three-dimensional plots
A class for conventional three-dimensional plots. Construction requires one PlotData3D dataset, meaning it is not possible to generate an empty plot. Afterwards, other datasets may be added using the add_data() method. Several properties may be set such as the axes and plot titles. Important is that whenever a property is changed, signal_changed() is emitted, which will eventually be picked up by the canvas that will hold the plot. For more information, the reader is referred to the examples Example 9: a Three-dimensional plot.
 Public Member Functions inherited from Gtk::PLplot::Plot