Examples
Table of Contents
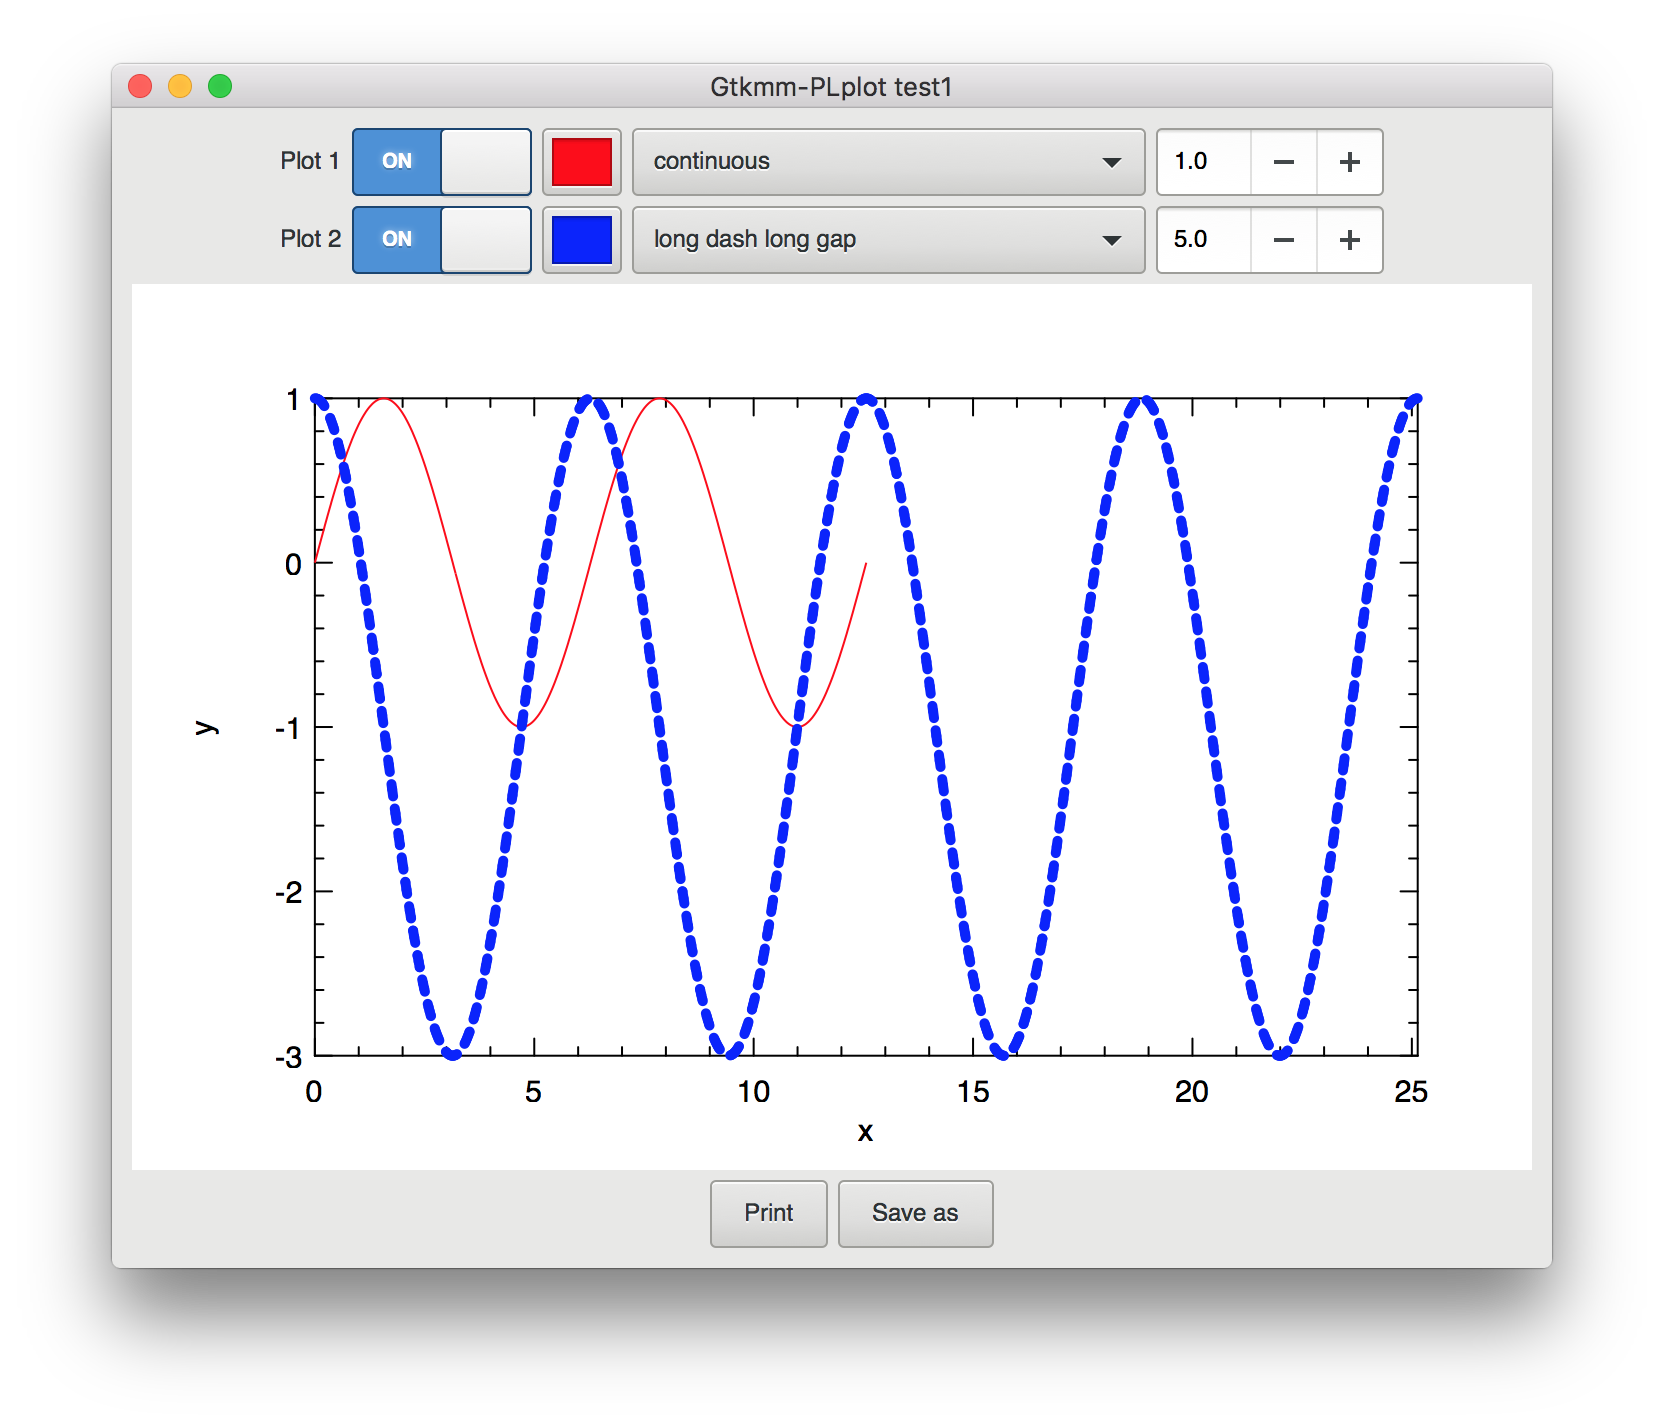
- Example 1: Plot data properties and zooming
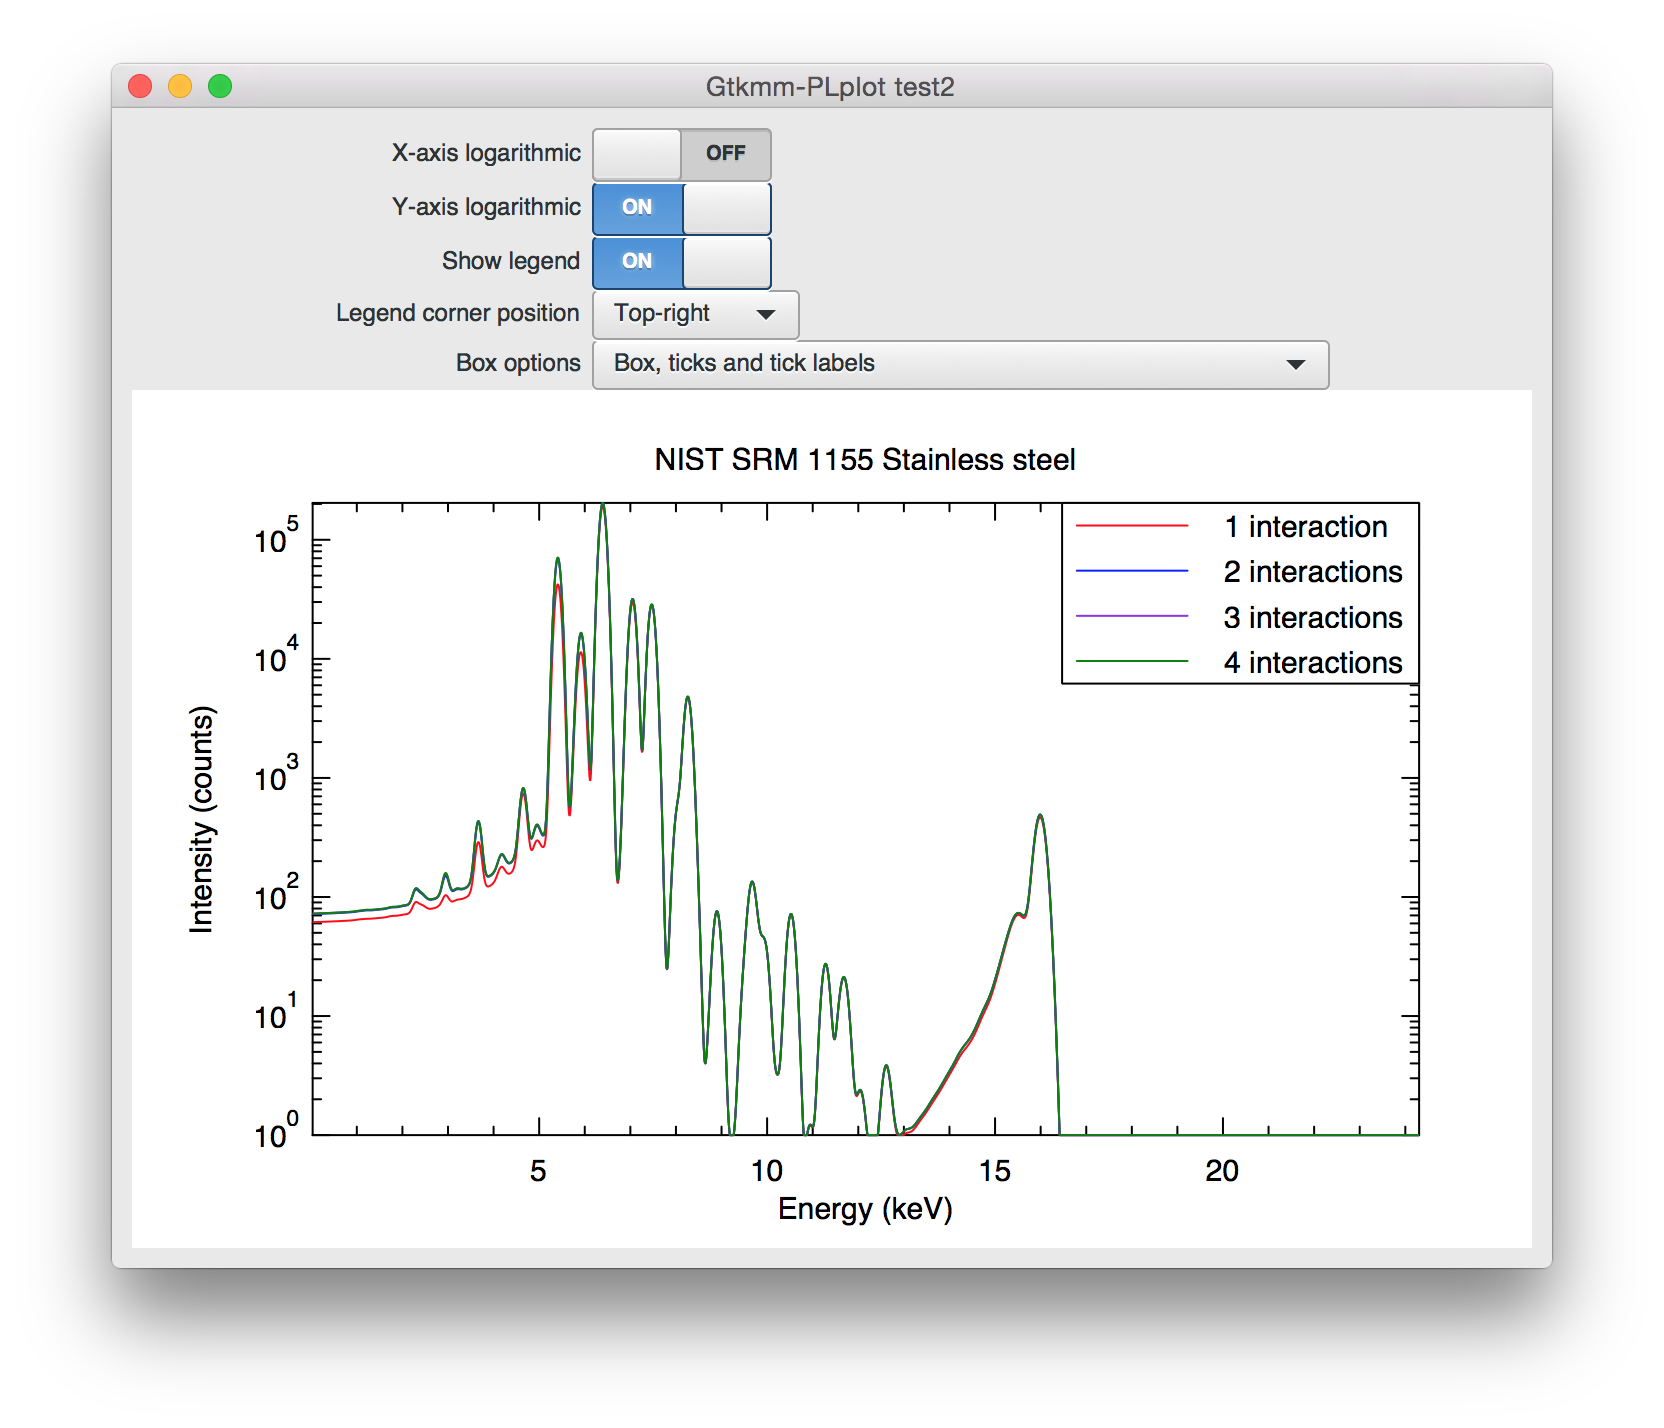
- Example 2: Logarithmic axes and box styles
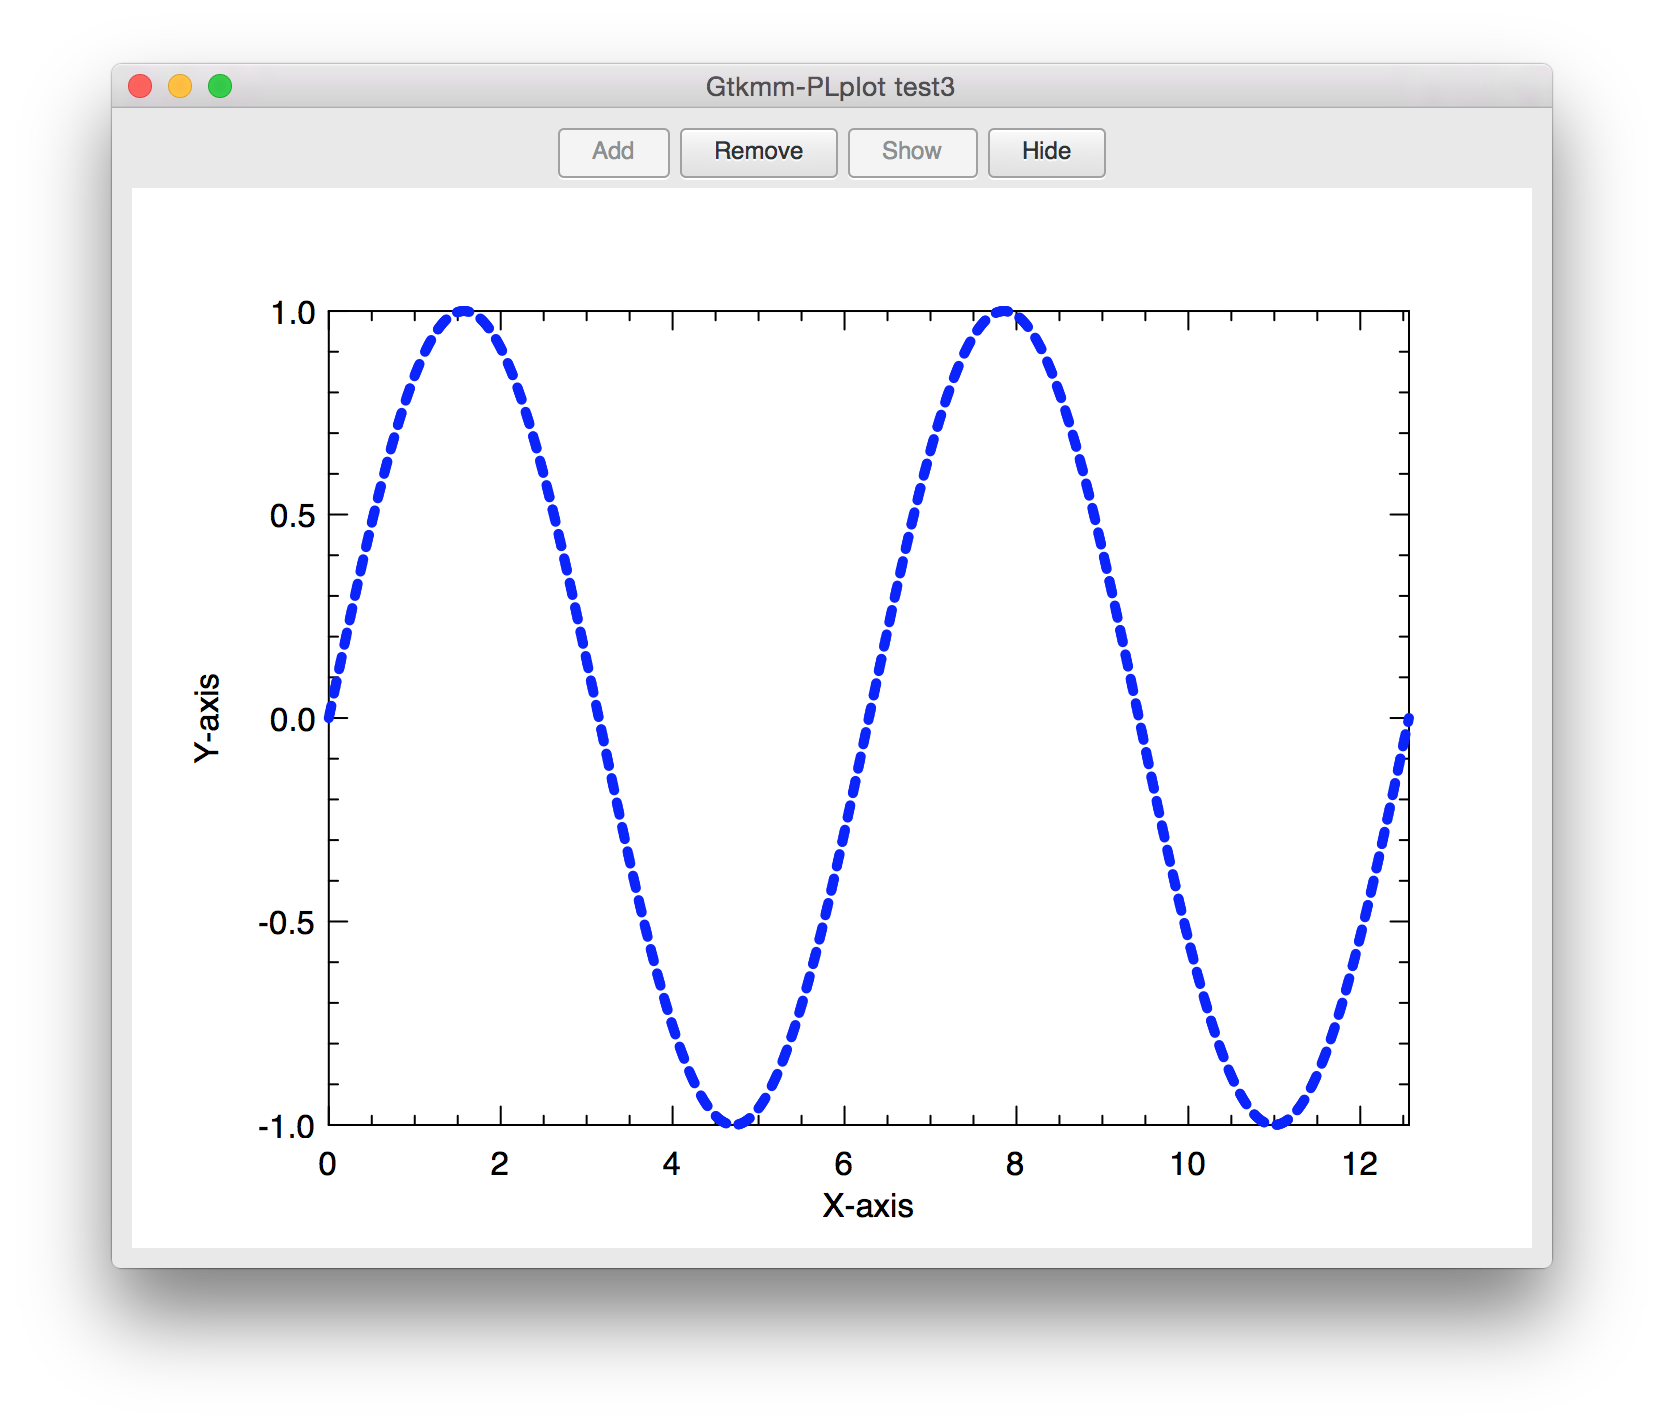
- Example 3: Adding, removing, showing and hiding plots
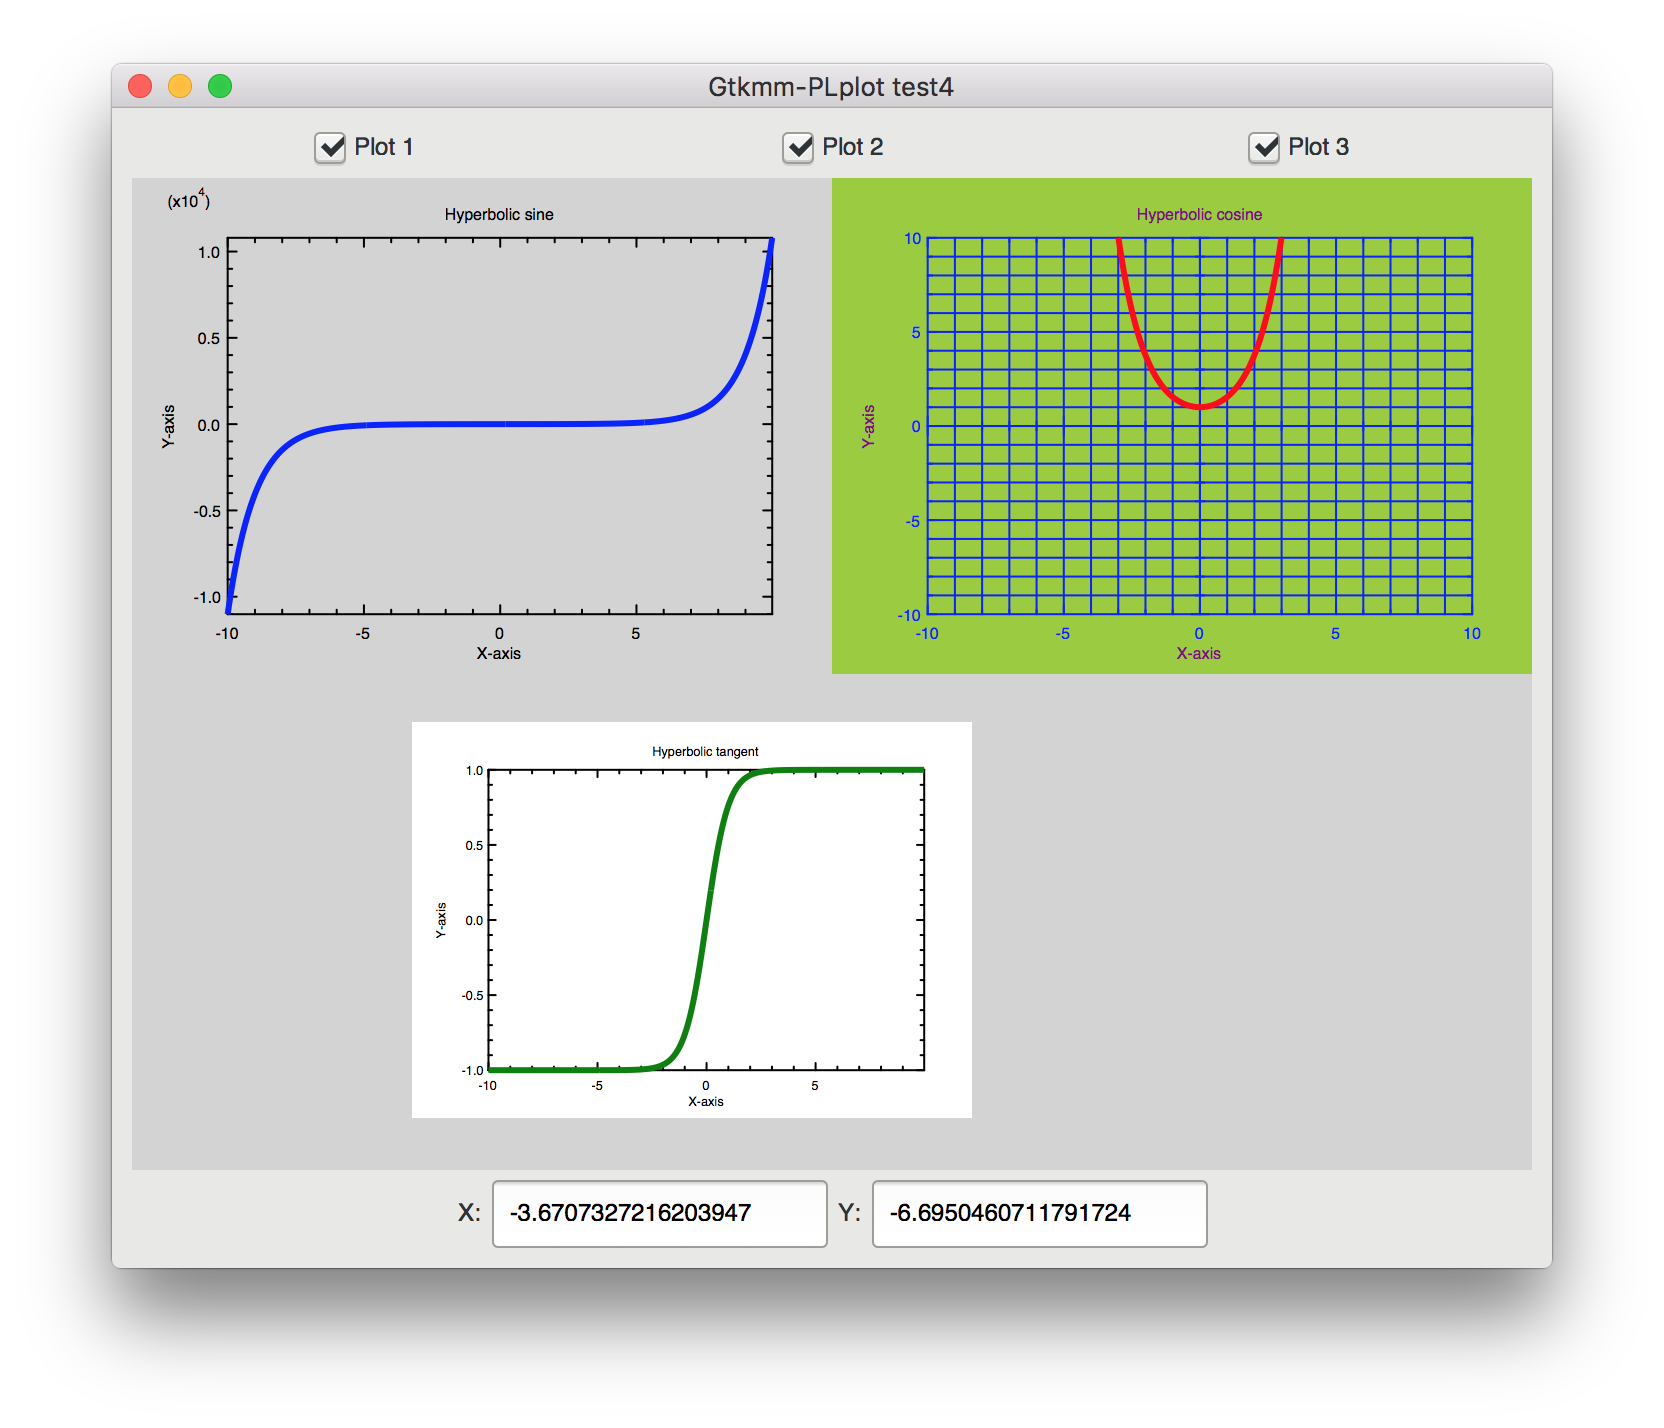
- Example 4: Displaying multiple plots on a single canvas
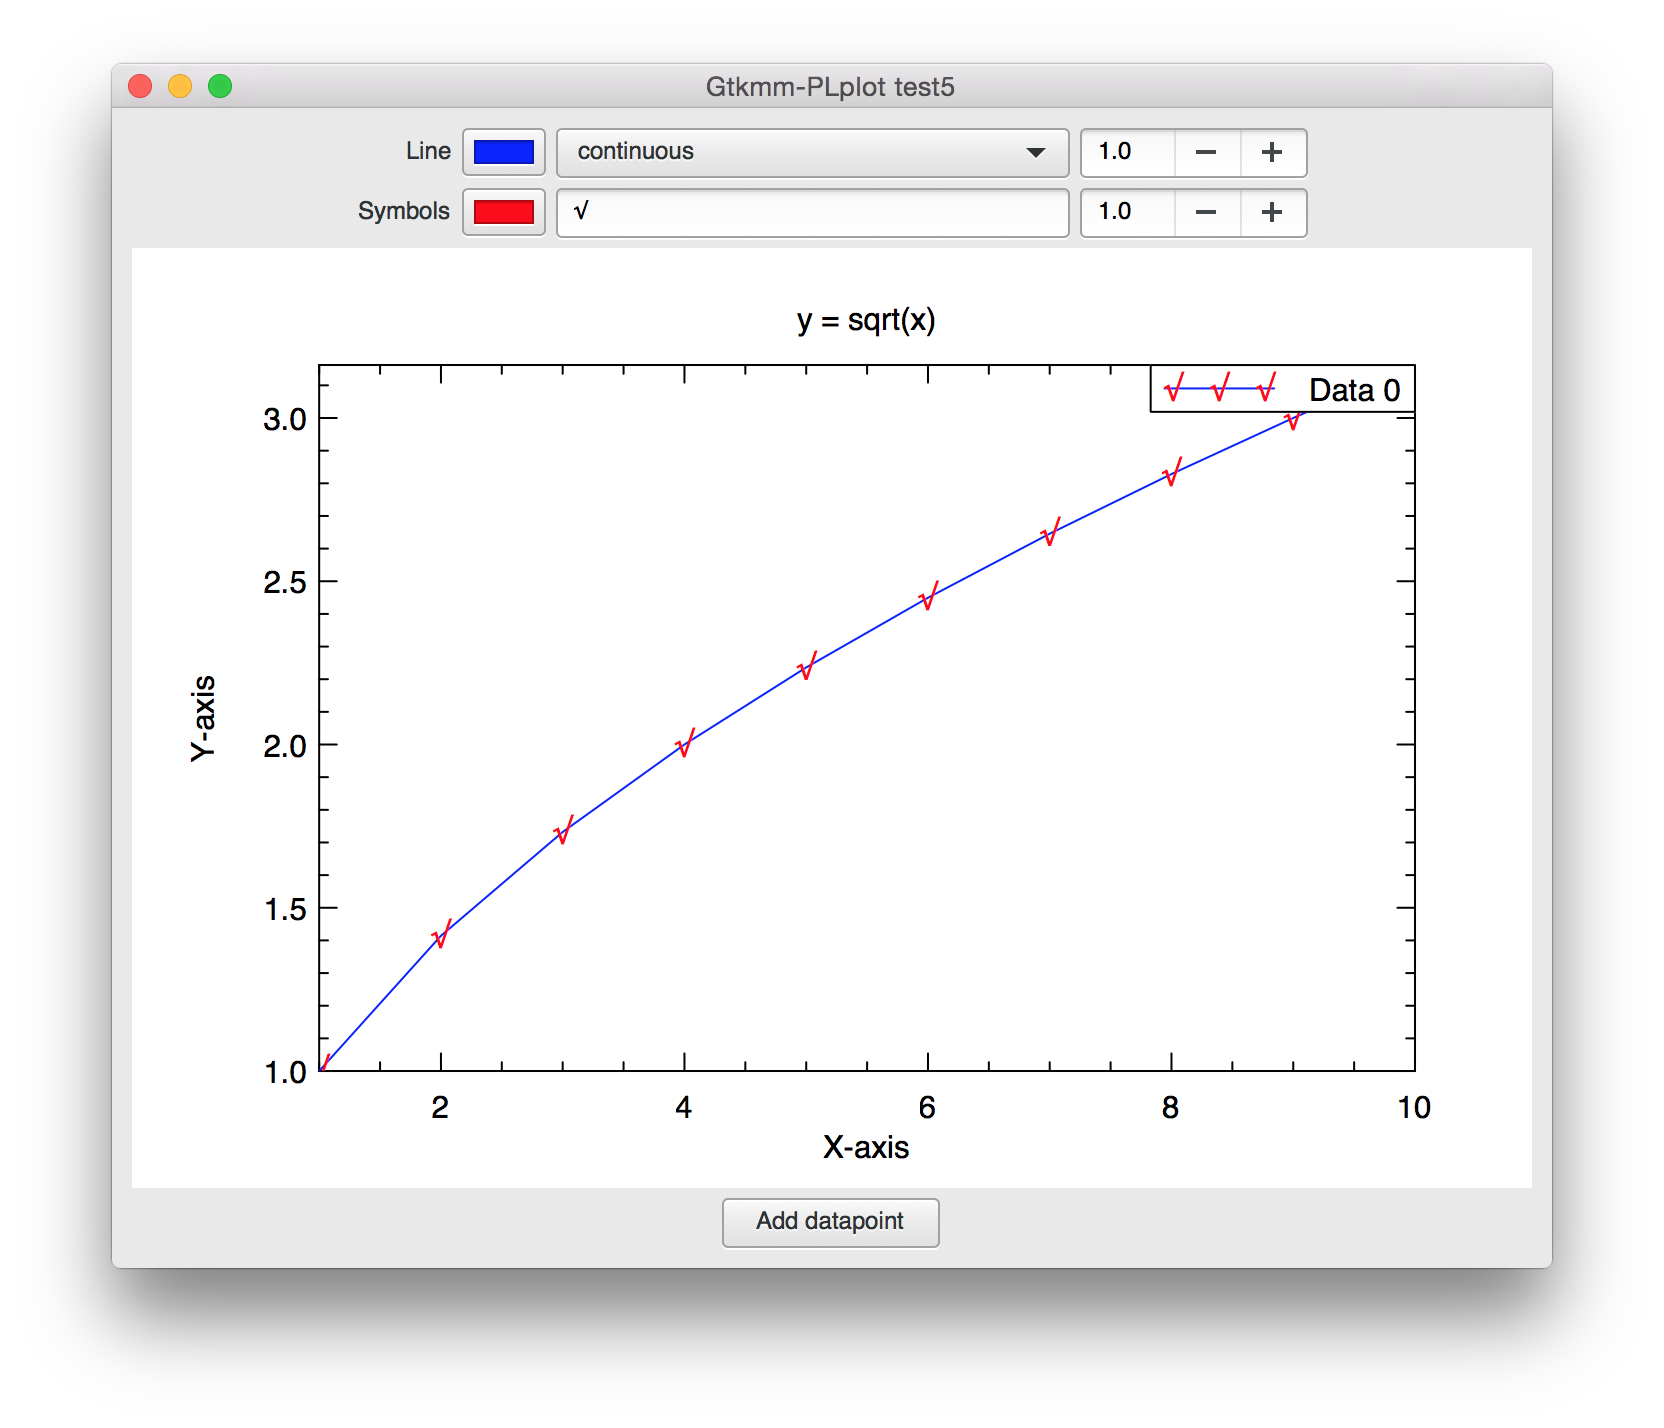
- Example 5: Mixing plot lines and symbols plus adding datapoints
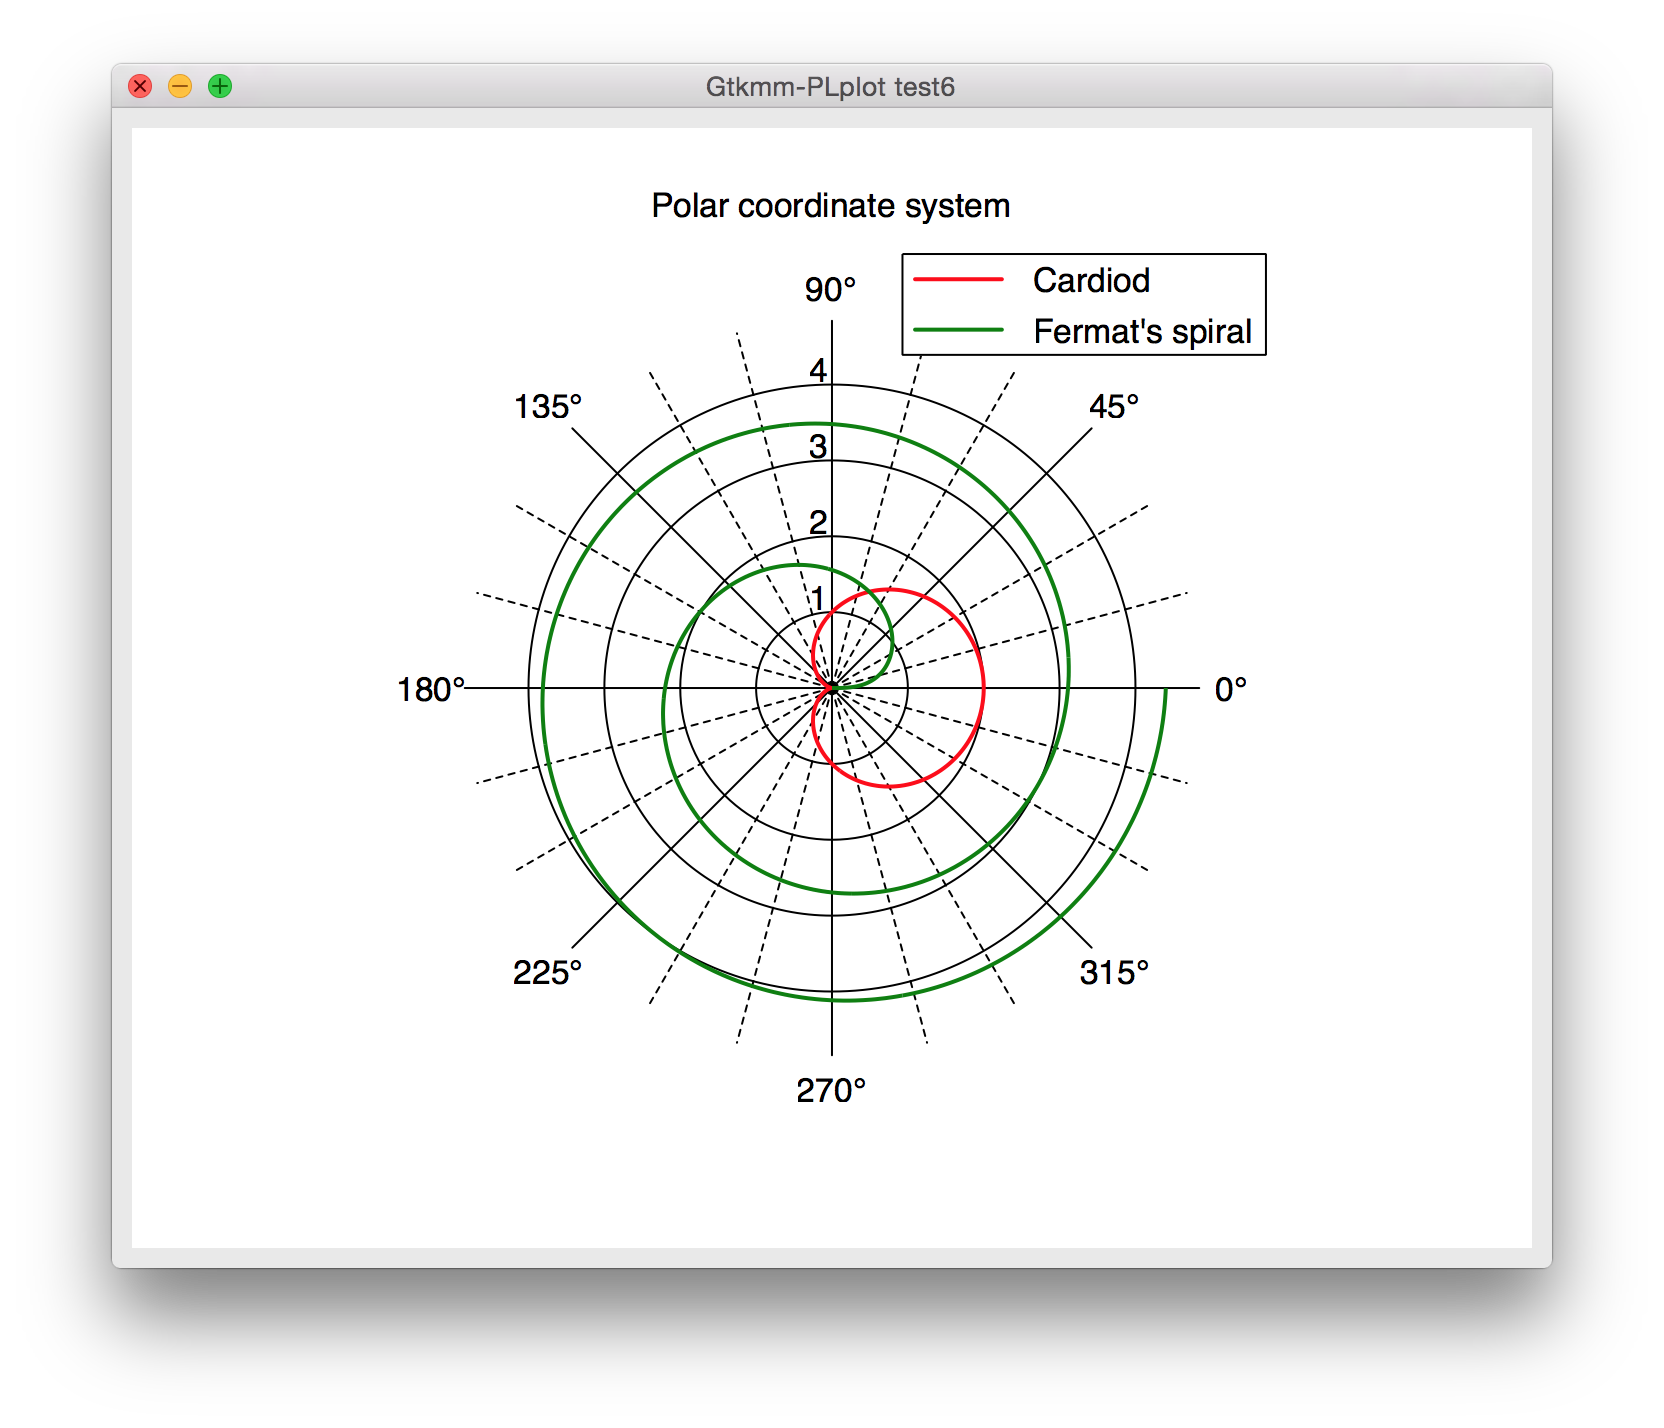
- Example 6: Polar coordinate systems
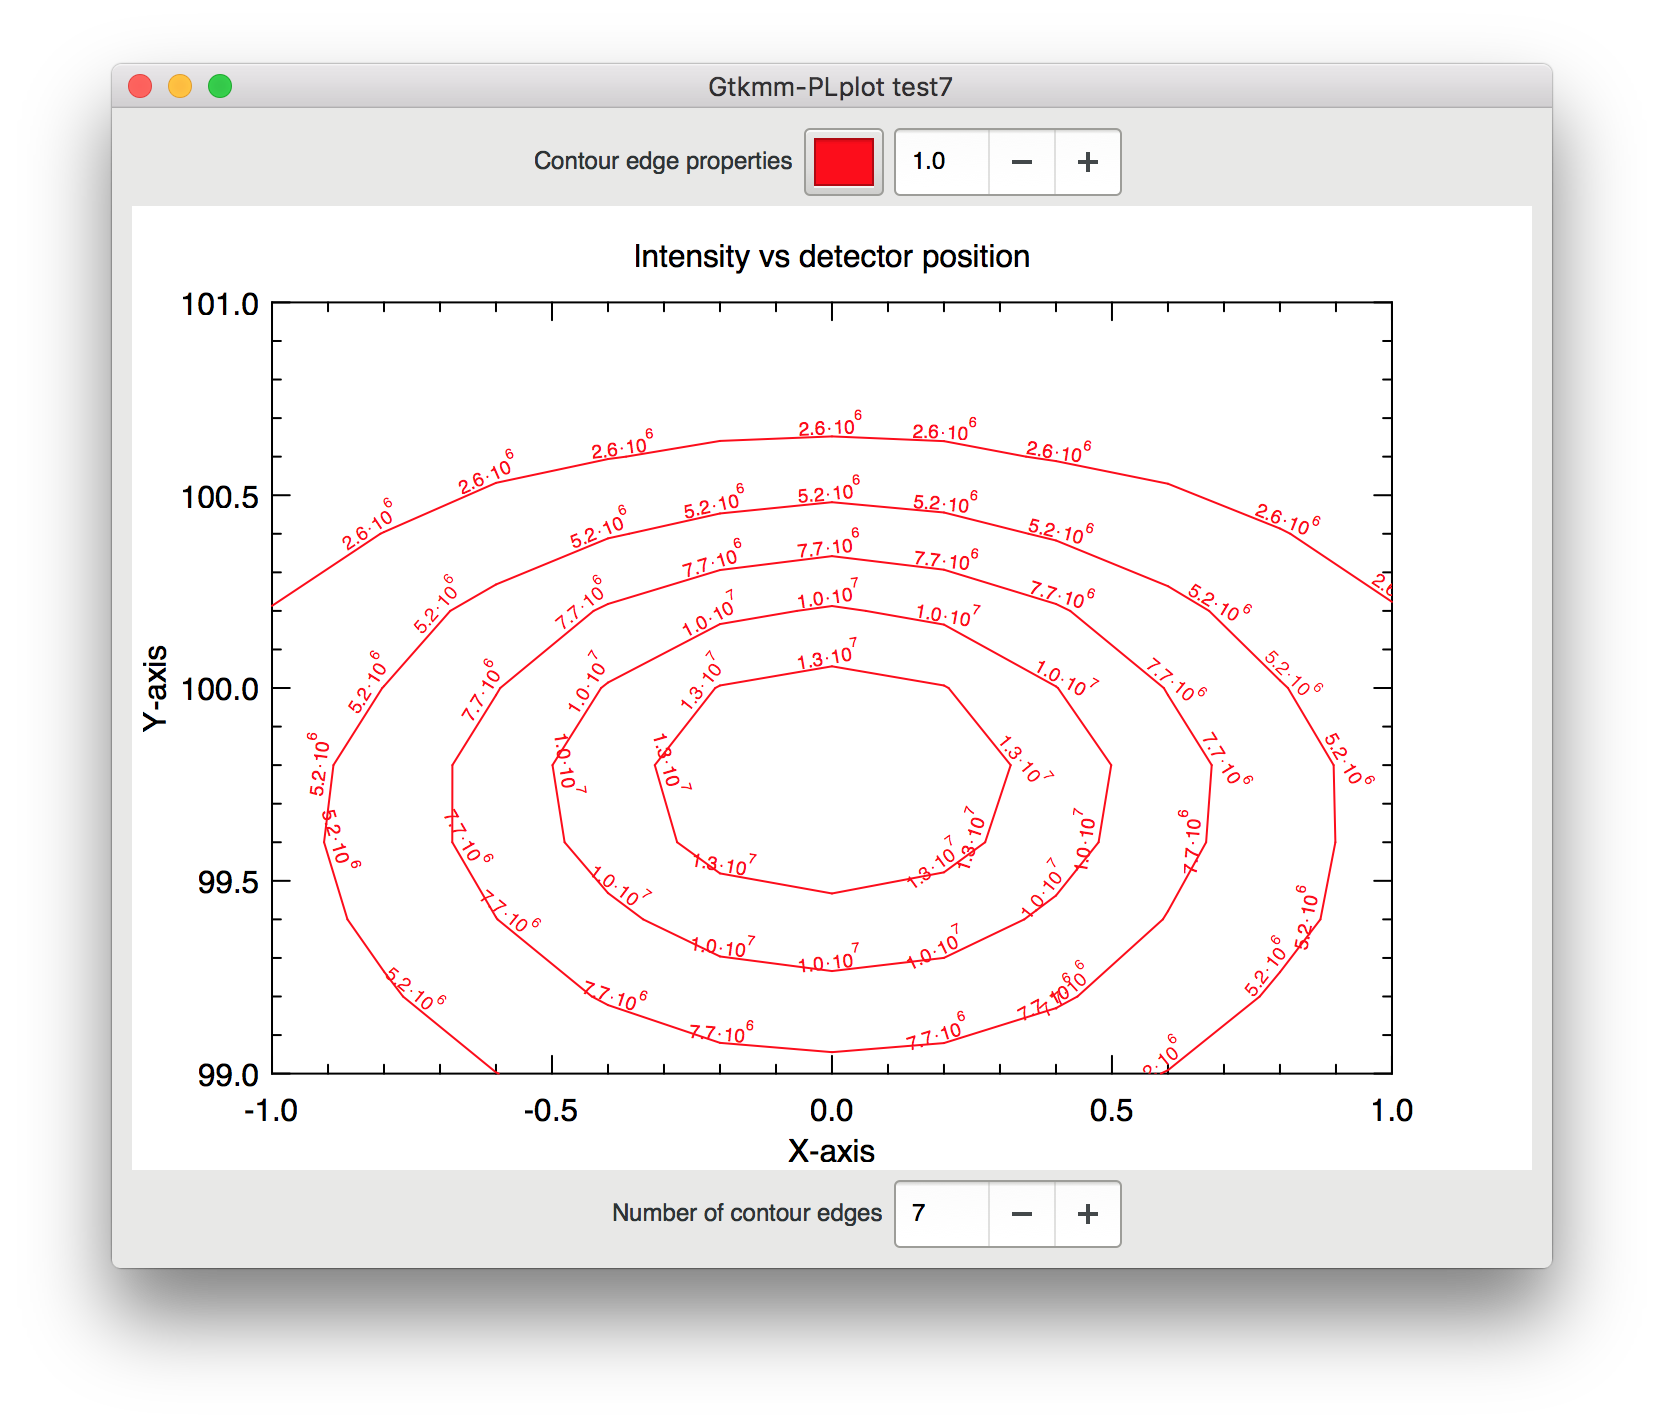
- Example 7: a Simple contour plot
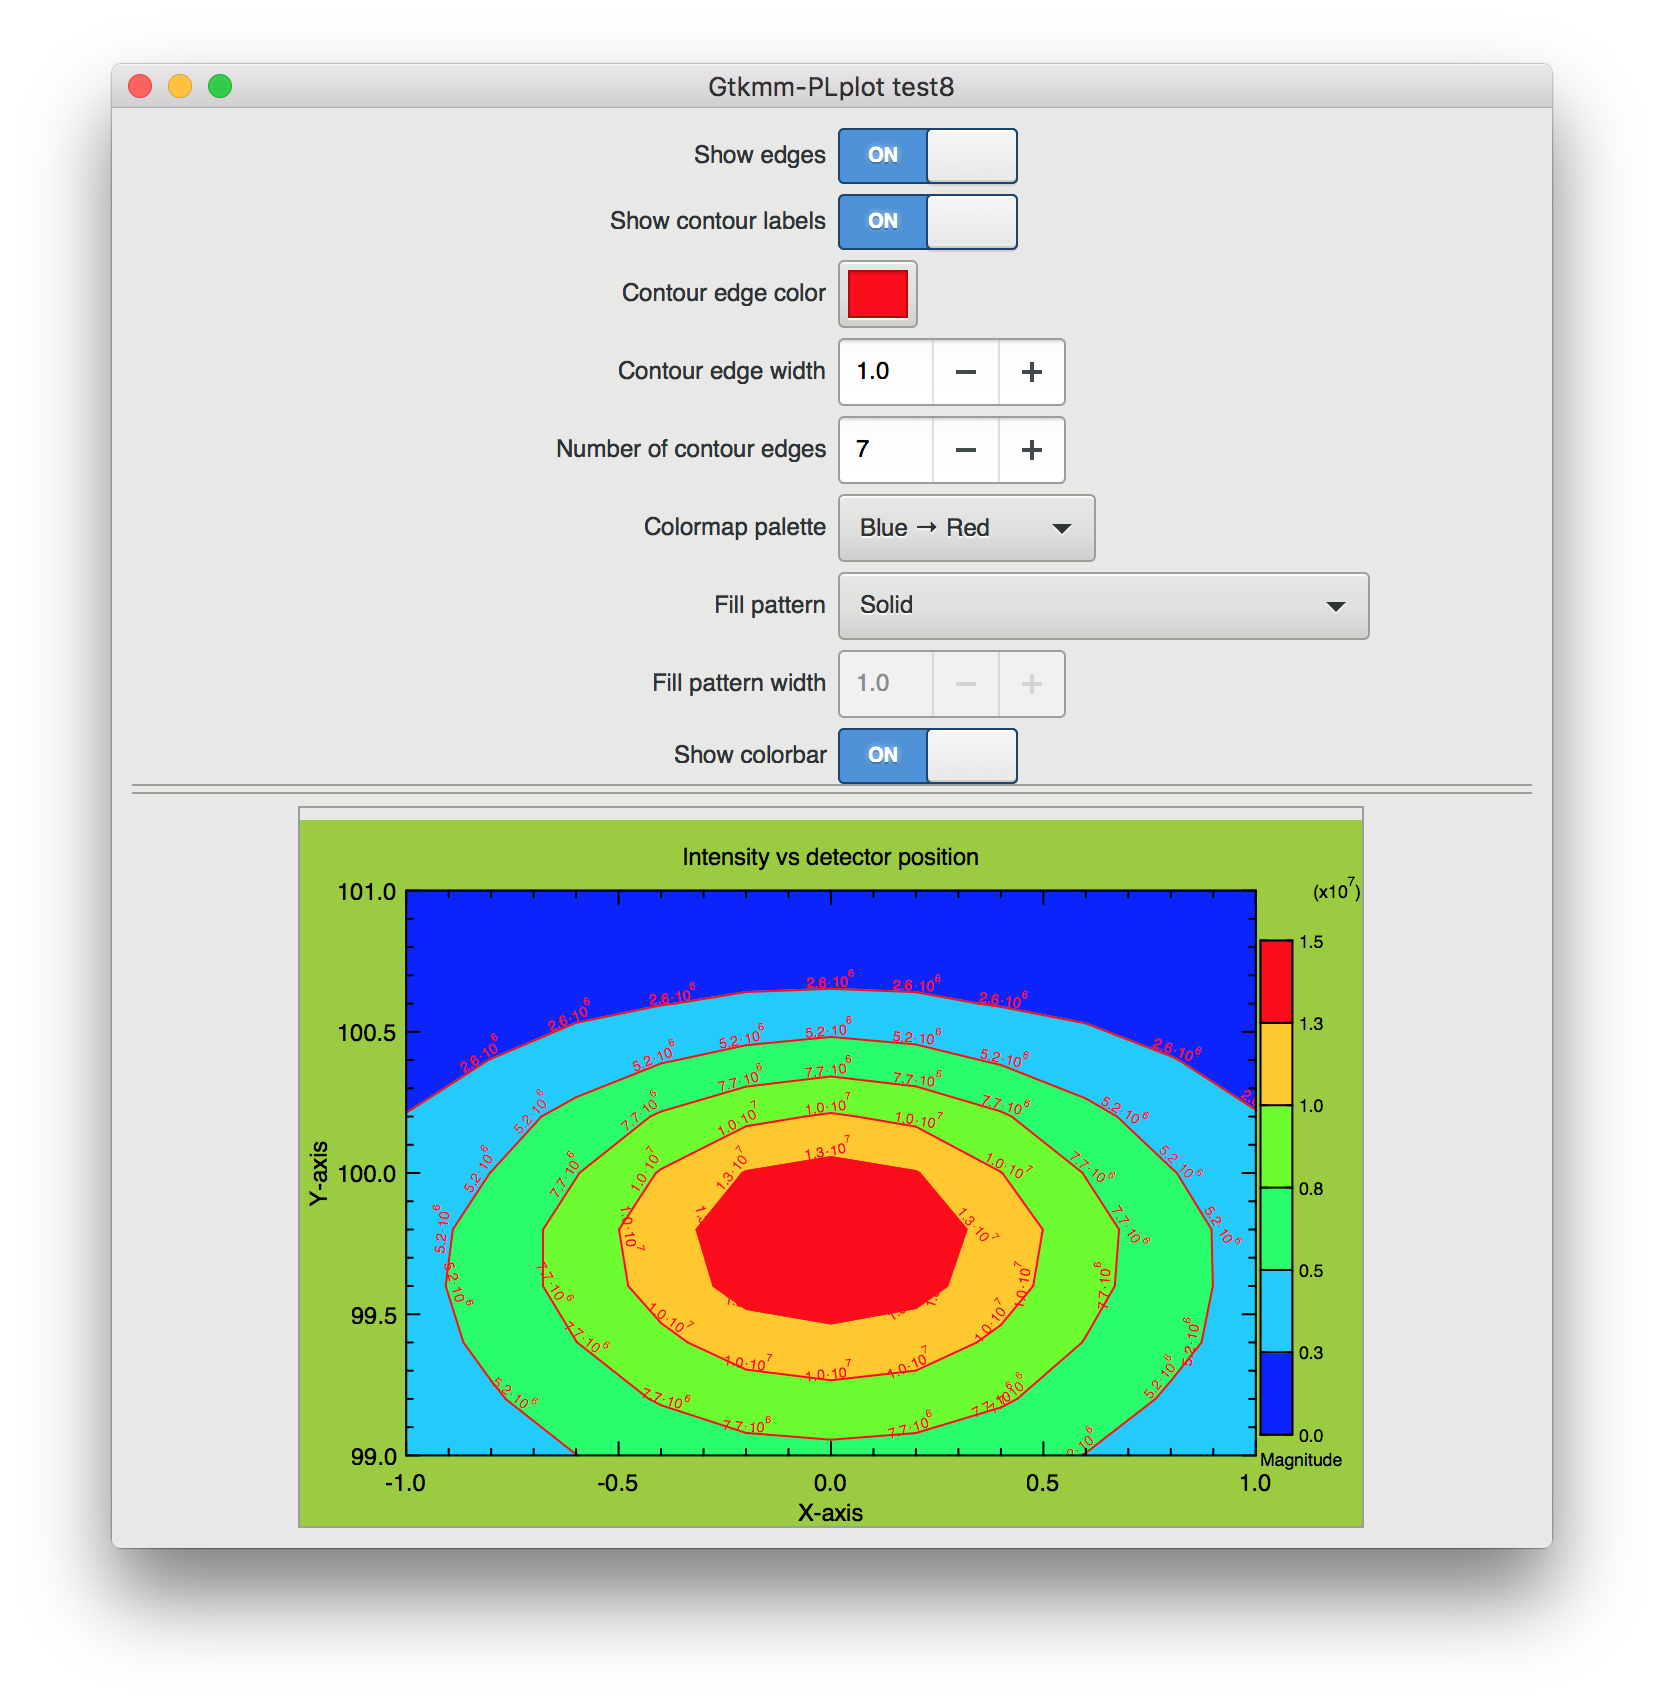
- Example 8: a Shaded contour plot
- Example 9: a Three-dimensional plot
- Example 10: use Gtkmm-PLplot from Gtk+
- Example 11: 2 dimensional plots with errorbars
- Example 12: Histograms
- Example 13: Dates and times
This page contains the code of the tests I have included to demonstrate the capabilities of Gtkmm-PLplot. The code should be quite straightforward and contains some commenting where useful. Every testcase is followed by a screenshot of the corresponding running program.
Example 1: Plot data properties and zooming
/*
Copyright (C) 2015 Tom Schoonjans
This program is free software: you can redistribute it and/or modify
it under the terms of the GNU Lesser General Public License as published by
the Free Software Foundation, either version 3 of the License, or
(at your option) any later version.
This program is distributed in the hope that it will be useful,
but WITHOUT ANY WARRANTY; without even the implied warranty of
MERCHANTABILITY or FITNESS FOR A PARTICULAR PURPOSE. See the
GNU Lesser General Public License for more details.
You should have received a copy of the GNU Lesser General Public License
along with this program. If not, see <http://www.gnu.org/licenses/>.
*/
#include "gtkmm-plplot.h"
#include <gtkmm/application.h>
#include <gtkmm/aspectframe.h>
#include <glibmm/miscutils.h>
#include <glib.h>
#include <gtkmm/window.h>
#include <gtkmm/switch.h>
#include <gtkmm/label.h>
#include <gtkmm/comboboxtext.h>
#include <gtkmm/grid.h>
#include <gtkmm/spinbutton.h>
#include <gtkmm/colorbutton.h>
#include <gtkmm/printsettings.h>
#include <gtkmm/pagesetup.h>
#include <gtkmm/printoperation.h>
#include <gtkmm/filechooserdialog.h>
#ifndef M_PI
#define M_PI (3.14159265358979323846)
#endif
namespace Test1 {
class Window : public Gtk::Window {
private:
Gtk::PLplot::PlotData2D plot_data1;
Gtk::PLplot::Plot2D plot;
Gtk::PLplot::Canvas canvas;
Gtk::Grid grid;
Gtk::Label label1;
Gtk::Label label2;
Gtk::ColorButton color_combo1;
Gtk::ColorButton color_combo2;
Gtk::ComboBoxText linestyle_combo1;
Gtk::ComboBoxText linestyle_combo2;
Gtk::Switch show_radio1;
Gtk::Switch show_radio2;
Glib::RefPtr<Gtk::Adjustment> linewidth_adj1;
Glib::RefPtr<Gtk::Adjustment> linewidth_adj2;
Gtk::SpinButton linewidth_spin1;
Gtk::SpinButton linewidth_spin2;
Gtk::Button print_button;
Gtk::Button saveas_button;
public:
Window(std::valarray<double> &x, std::valarray<double> &y,
Glib::ustring x_title = "X-axis", Glib::ustring y_title = "Y-axis",
Glib::ustring plot_title = "", Gdk::RGBA color = Gdk::RGBA("red")) :
plot_data1(x, y, color),
plot(plot_data1, x_title, y_title, plot_title),
canvas(plot),
label1("Plot 1"), label2("Plot 2"),
linewidth_adj1(Gtk::Adjustment::create(1.0, 0.1, 10.0, 0.1, 1.0, 0.0)),
linewidth_adj2(Gtk::Adjustment::create(1.0, 0.1, 10.0, 0.1, 1.0, 0.0)),
linewidth_spin1(linewidth_adj1, 0.1, 1.0),
linewidth_spin2(linewidth_adj2, 0.1, 1.0),
print_button("Print"),
saveas_button("Save as") {
//let's make this more interesting by adding more data
std::valarray<double> x_va(1000), y_va(1000);
for (unsigned int i = 0 ; i < 1000 ; i++) {
x_va[i] = 8*M_PI*i/999;
}
y_va = 2*cos(x_va)-1;
// Gtk::manage can be used for memory management here...
plot.add_data(*Gtk::manage(new Gtk::PLplot::PlotData2D(x_va, y_va, Gdk::RGBA("blue"), Gtk::PLplot::LineStyle::LONG_DASH_LONG_GAP, 5.0)));
plot.hide_legend();
// add some lines
//plot.add_object(*Gtk::manage(new Gtk::PLplot::PlotObject2DLine(-5, -1, 30, -2)));
const int width = 1024, height = 580;
set_title("Gtkmm-PLplot test1");
canvas.set_vexpand(true);
canvas.set_hexpand(true);
canvas.set_focusable(true);
canvas.set_size_request(-1, height);
Gtk::AspectFrame geometry(Gtk::Align::CENTER, Gtk::Align::CENTER, float(width)/float(height));
geometry.set_child(canvas);
show_radio1.set_active(plot_data1.is_showing());
show_radio2.set_active(plot.get_data(1)->is_showing());
show_radio1.property_active().signal_changed().connect([this](){
if (show_radio1.get_active()) {
plot_data1.show();
color_combo1.set_sensitive(true);
linestyle_combo1.set_sensitive(true);
linewidth_spin1.set_sensitive(true);
}
else {
// another way to access our data, though this is really just plot_data1
canvas.get_plot(0)->get_data(0)->hide();
color_combo1.set_sensitive(false);
linestyle_combo1.set_sensitive(false);
linewidth_spin1.set_sensitive(false);
}
});
show_radio2.property_active().signal_changed().connect([this](){
if (show_radio2.get_active()) {
canvas.get_plot(0)->get_data(1)->show();
color_combo2.set_sensitive(true);
linestyle_combo2.set_sensitive(true);
linewidth_spin2.set_sensitive(true);
}
else {
plot.get_data(1)->hide();
color_combo2.set_sensitive(false);
linestyle_combo2.set_sensitive(false);
linewidth_spin2.set_sensitive(false);
}
});
linestyle_combo1.append("continuous");
linestyle_combo1.append("short dash short gap");
linestyle_combo1.append("long dash long gap");
linestyle_combo1.append("long dash short gap");
linestyle_combo1.append("long dash short gap short dash short gap");
linestyle_combo1.append("long dash short gap long dash short gap");
linestyle_combo2.append("continuous");
linestyle_combo2.append("short dash short gap");
linestyle_combo2.append("long dash long gap");
linestyle_combo2.append("long dash short gap");
linestyle_combo2.append("long dash short gap short dash short gap");
linestyle_combo2.append("long dash short gap long dash short gap");
linewidth_spin1.set_wrap(true);
linewidth_spin2.set_wrap(true);
linewidth_spin1.set_snap_to_ticks(true);
linewidth_spin2.set_snap_to_ticks(true);
linewidth_spin1.set_numeric(true);
linewidth_spin2.set_numeric(true);
color_combo1.set_hexpand(false);
color_combo2.set_hexpand(false);
linewidth_spin1.set_halign(Gtk::Align::START);
linewidth_spin2.set_halign(Gtk::Align::START);
show_radio1.set_hexpand(false);
show_radio2.set_hexpand(false);
label1.set_hexpand(true);
label2.set_hexpand(true);
linewidth_spin1.set_hexpand(true);
linewidth_spin2.set_hexpand(true);
linestyle_combo1.set_hexpand(false);
linestyle_combo2.set_hexpand(false);
label1.set_halign(Gtk::Align::END);
label2.set_halign(Gtk::Align::END);
grid.set_column_homogeneous(false);
grid.set_column_spacing(5);
grid.set_row_spacing(5);
// unlike plot_data1, plot_data2 is a pointer!
color_combo1.set_rgba(plot_data1.get_color());
color_combo2.set_rgba(plot_data2->get_color());
color_combo1.set_use_alpha(true);
color_combo2.set_use_alpha(true);
linestyle_combo1.set_active(plot_data1.get_line_style()-1);
linestyle_combo2.set_active(plot_data2->get_line_style()-1);
color_combo1.signal_color_set().connect([this](){plot_data1.set_color(color_combo1.get_rgba());});
color_combo2.signal_color_set().connect([this, plot_data2](){plot_data2->set_color(color_combo2.get_rgba());});
linestyle_combo1.signal_changed().connect([this](){plot_data1.set_line_style(static_cast<Gtk::PLplot::LineStyle>(linestyle_combo1.get_active_row_number()+1));});
linestyle_combo2.signal_changed().connect([this, plot_data2](){plot_data2->set_line_style(static_cast<Gtk::PLplot::LineStyle>(linestyle_combo2.get_active_row_number()+1));});
linewidth_spin1.set_value(plot_data1.get_line_width());
linewidth_spin2.set_value(plot_data2->get_line_width());
linewidth_spin1.signal_value_changed().connect([this](){plot_data1.set_line_width(linewidth_spin1.get_value());});
linewidth_spin2.signal_value_changed().connect([this, plot_data2](){plot_data2->set_line_width(linewidth_spin2.get_value());});
grid.attach(label1, 0, 0, 1, 1);
grid.attach(show_radio1, 1, 0, 1, 1);
grid.attach(color_combo1, 2, 0, 1, 1);
grid.attach(linestyle_combo1, 3, 0, 1, 1);
grid.attach(linewidth_spin1, 4, 0, 1, 1);
grid.attach(label2, 0, 1, 1, 1);
grid.attach(show_radio2, 1, 1, 1, 1);
grid.attach(color_combo2, 2, 1, 1, 1);
grid.attach(linestyle_combo2, 3, 1, 1, 1);
grid.attach(linewidth_spin2, 4, 1, 1, 1);
grid.attach(geometry, 0, 2, 5, 1);
Gtk::Grid *button_grid = Gtk::manage(new Gtk::Grid());
button_grid->set_column_homogeneous(true);
button_grid->set_column_spacing(5);
button_grid->set_row_spacing(5);
button_grid->attach(print_button, 0, 0, 1, 1);
button_grid->attach(saveas_button, 1, 0, 1, 1);
grid.attach(*button_grid, 0, 3, 5, 1);
print_button.set_hexpand(false);
saveas_button.set_hexpand(false);
print_button.set_vexpand(false);
saveas_button.set_vexpand(false);
print_button.set_halign(Gtk::Align::END);
saveas_button.set_halign(Gtk::Align::START);
print_button.signal_clicked().connect(sigc::mem_fun(*this, &Window::on_print_button_clicked));
saveas_button.signal_clicked().connect(sigc::mem_fun(*this, &Window::on_saveas_button_clicked));
grid.set_margin(10);
set_child(grid);
}
virtual ~Window() {}
void on_draw_page(const Glib::RefPtr<Gtk::PrintContext>& context, int page_nr) {
Cairo::RefPtr< ::Cairo::Context> cr = context->get_cairo_context();
canvas.draw_plot(cr, 842, 595);
}
void on_print_button_clicked() {
//print settings
Glib::RefPtr<Gtk::PrintSettings> print_settings = Gtk::PrintSettings::create();
print_settings->set_orientation(Gtk::PageOrientation::LANDSCAPE);
print_settings->set_paper_size(Gtk::PaperSize(Gtk::PAPER_NAME_A4));
Glib::RefPtr<Gtk::PageSetup> page_setup = Gtk::PageSetup::create();
page_setup->set_orientation(Gtk::PageOrientation::LANDSCAPE);
page_setup->set_paper_size_and_default_margins(Gtk::PaperSize(Gtk::PAPER_NAME_A4));
Glib::RefPtr<Gtk::PrintOperation> operation = Gtk::PrintOperation::create();
operation->set_print_settings(print_settings);
operation->set_default_page_setup(page_setup);
operation->set_show_progress(true);
operation->set_track_print_status(true);
operation->set_use_full_page(true);
operation->signal_draw_page().connect(sigc::mem_fun(*this, &Window::on_draw_page));
operation->set_n_pages(1);
if (Gtk::PrintOperation::Result::APPLY != operation->run(Gtk::PrintOperation::Action::PRINT_DIALOG, *this)) {
//error handling
}
return;
}
void on_saveas_button_clicked() {
auto dialog = new Gtk::FileChooserDialog("Save as", Gtk::FileChooser::Action::SAVE);
dialog->set_transient_for(*this);
dialog->set_modal(true);
dialog->signal_response().connect(sigc::bind(
sigc::mem_fun(*this, &Window::on_file_dialog_response), dialog));
dialog->add_button("_Cancel", Gtk::ResponseType::CANCEL);
dialog->add_button("_Select", Gtk::ResponseType::OK);
Glib::RefPtr<Gtk::FileFilter> filter_eps = Gtk::FileFilter::create();
filter_eps->add_pattern("*.eps");
filter_eps->set_name("EPS");
dialog->add_filter(filter_eps);
Glib::RefPtr<Gtk::FileFilter> filter_png = Gtk::FileFilter::create();
filter_png->add_pattern("*.png");
filter_png->set_name("PNG");
dialog->add_filter(filter_png);
Glib::RefPtr<Gtk::FileFilter> filter_pdf = Gtk::FileFilter::create();
filter_pdf->add_pattern("*.pdf");
filter_pdf->set_name("PDF");
dialog->add_filter(filter_pdf);
dialog->show();
}
void on_file_dialog_response(int response_id, Gtk::FileChooserDialog *dialog) {
if (response_id != Gtk::ResponseType::OK) {
delete dialog;
return;
}
std::string filename = dialog->get_file()->get_path();
Glib::RefPtr<Gtk::FileFilter> filter_selected = dialog->get_filter();
if (filter_selected->get_name() == "EPS") {
if (filename.compare(filename.length()-4, std::string::npos, ".eps") != 0)
filename += ".eps";
Cairo::RefPtr<Cairo::PsSurface> surface = Cairo::PsSurface::create(filename, 842, 595);
surface->set_eps(true);
Cairo::RefPtr<Cairo::Context> cr = Cairo::Context::create(surface);
canvas.draw_plot(cr, 842, 595);
cr->show_page();
}
else if (filter_selected->get_name() == "PNG") {
if (filename.compare(filename.length()-4, std::string::npos, ".png") != 0)
filename += ".png";
Cairo::RefPtr<Cairo::ImageSurface> surface = Cairo::ImageSurface::create(Cairo::ImageSurface::Format::ARGB32, 842, 595);
Cairo::RefPtr<Cairo::Context> cr = Cairo::Context::create(surface);
canvas.draw_plot(cr, 842, 595);
surface->write_to_png(filename);
}
else if (filter_selected->get_name() == "PDF") {
if (filename.compare(filename.length()-4, std::string::npos, ".pdf") != 0)
filename += ".pdf";
Cairo::RefPtr<Cairo::PdfSurface> surface = Cairo::PdfSurface::create(filename, 842, 595);
Cairo::RefPtr<Cairo::Context> cr = Cairo::Context::create(surface);
canvas.draw_plot(cr, 842, 595);
cr->show_page();
}
delete dialog;
}
};
}
int main(int argc, char **argv) {
Glib::set_application_name("gtkmm-plplot-test1");
Glib::RefPtr<Gtk::Application> app = Gtk::Application::create("eu.tomschoonjans.gtkmm-plplot-test1");
//valarrays are underestimated IMHO
std::valarray<double> x_va(1000), y_va(1000);
for (unsigned int i = 0 ; i < 1000 ; i++) {
x_va[i] = 4*M_PI*i/999;
}
y_va = sin(x_va);
return app->make_window_and_run<Test1::Window>(argc, argv, x_va, y_va, "x", "y");
}
void draw_plot(const Cairo::RefPtr< Cairo::Context > &cr, int width, int height)
void hide_legend()
virtual void add_object(PlotObject2D &object)
virtual void add_data(PlotData2D &data)
a class that will hold a single dataset and its properties for a Plot2D plot
Definition plotdata2d.h:42
sigc::signal< void(void)> signal_changed()
Definition plotdata.h:103
bool is_showing() const
double get_line_width()
Gdk::RGBA get_color()
void set_color(Gdk::RGBA color)
void set_line_width(double line_width)
LineStyle get_line_style()
void set_line_style(LineStyle line_style)
virtual PlotData * get_data(unsigned int data_index=0) final
@ LONG_DASH_LONG_GAP
a line consisting of alternating long dashes and long gaps
Definition enums.h:31
Example 1
Example 2: Logarithmic axes and box styles
/*
Copyright (C) 2015 Tom Schoonjans
This program is free software: you can redistribute it and/or modify
it under the terms of the GNU Lesser General Public License as published by
the Free Software Foundation, either version 3 of the License, or
(at your option) any later version.
This program is distributed in the hope that it will be useful,
but WITHOUT ANY WARRANTY; without even the implied warranty of
MERCHANTABILITY or FITNESS FOR A PARTICULAR PURPOSE. See the
GNU Lesser General Public License for more details.
You should have received a copy of the GNU Lesser General Public License
along with this program. If not, see <http://www.gnu.org/licenses/>.
*/
#include <gtkmm-plplot.h>
#include <gtkmm/application.h>
#include <gtkmm/aspectframe.h>
#include <gtkmm/colorbutton.h>
#include <gtkmm/spinbutton.h>
#include <glibmm/miscutils.h>
#include <gtkmm/window.h>
#include <iostream>
#include <sstream>
#include <fstream>
#include <glib.h>
#include <gtkmm/grid.h>
#include <gtkmm/label.h>
#include <gtkmm/switch.h>
#include <gtkmm/comboboxtext.h>
#include <vector>
#define START_TEXT "Fe-Kα"
namespace Test2 {
class Window : public Gtk::Window {
private:
Gtk::PLplot::Canvas canvas;
Gtk::Grid grid;
Gtk::Label x_log_label;
Gtk::Label x_box_label;
Gtk::Label y_log_label;
Gtk::Label y_box_label;
Gtk::Label box_label;
Gtk::Switch x_log_switch;
Gtk::Switch y_log_switch;
Gtk::ComboBoxText box_combo;
Gtk::Label legend_label;
Gtk::Switch legend_switch;
Gtk::Label corner_label;
Gtk::ComboBoxText corner_combo;
Gtk::Label text_label;
Gtk::Entry text_entry;
Gtk::Label text_color_label;
Gtk::ColorButton text_color_button;
Gtk::Label text_justification_label;
Gtk::SpinButton text_justification_spin_button;
Gtk::Label text_scale_factor_label;
Gtk::SpinButton text_scale_factor_spin_button;
Gtk::Label text_orientation_label;
Gtk::Switch text_orientation_switch;
Gtk::PLplot::PlotData2D plot_data1;
Gtk::PLplot::PlotObject2DText plot_text2d;
Gtk::PLplot::PlotObject2DLine plot_line2d;
public:
Window(std::vector<double> &x,
std::vector<double> &y1,
std::vector<double> &y2,
std::vector<double> &y3,
std::vector<double> &y4,
Glib::ustring x_title,
Glib::ustring y_title,
Glib::ustring plot_title) :
canvas(),
x_log_label("X-axis logarithmic"),
y_log_label("Y-axis logarithmic"),
box_label("Box options"),
legend_label("Show legend"),
corner_label("Legend corner position"),
text_label("Text"),
text_entry(Gtk::EntryBuffer::create(START_TEXT)),
text_color_label("Text color"),
text_color_button(Gdk::RGBA("red")),
text_justification_label("Text justification"),
text_justification_spin_button(Gtk::Adjustment::create(0.5, 0.0, 1.0, 0.1, 0.2), 0.0, 2),
text_scale_factor_label("Text scale factor"),
text_scale_factor_spin_button(Gtk::Adjustment::create(1.0, 0.1, 10.0, 0.1, 0.2), 0.0, 2),
text_orientation_label("Text vertical?"),
plot_data1(x, y1, Gdk::RGBA("red")),
plot_text2d(START_TEXT, 6.4039 + 0.3, 1E5, Gdk::RGBA("red")),
plot_line2d(Gtk::Orientation::VERTICAL, 6.4039, Gdk::RGBA("purple"), Gtk::PLplot::LineStyle::LONG_DASH_LONG_GAP, 3.0)
{
// The first dataset is a class member variable,
// meaning that it will be destroyed along with
// the Window when it is closed. It is is constructed in the
// constructor initialization list.
// Next, construct a plot with this dataset (mandatory).
// Here I am using a managed pointer, but a class member variable would
// in this case have been equally good. The fact that it is managed
// means that we will not have to delete it when the canvas that will
// own it gets destroyed.
Gtk::PLplot::Plot2D *plot = Gtk::manage(new Gtk::PLplot::Plot2D(plot_data1, x_title, y_title, plot_title));
// Additional datasets may be added using add_data
// Again, I will be using managed pointers here, but class member
// variables would have worked out just as well in this case.
Gtk::PLplot::PlotData2D *plot_data2 = Gtk::manage(new Gtk::PLplot::PlotData2D(x, y2, Gdk::RGBA("blue")));
plot->add_data(*plot_data2);
// This next line creates and adds a dataset. However, the memory will
// not be managed by Gtkmm-PLplot!!!
// DO NOT DO THIS as it creates a memory leak unless handled for example
// in on_delete_event or something like that...
// Alternatively, plot_data3 could be turned into a class member variable,
// and could then be deleted in the destructor...
// So in this example we are naughty and create intentionally a memory leak...
// add our text object
//plot_text2d.set_justification(0.5);
plot->add_object(plot_text2d);
// and the vertical line
plot->add_object(plot_line2d);
canvas.add_plot(*plot);
plot_data1.set_name("1 interaction");
plot_data2->set_name("2 interactions");
plot_data3->set_name("3 interactions");
plot_data4->set_name("4 interactions");
plot->set_axis_logarithmic_y();
const int width = 1600, height = 1024;
set_default_size(width, height);
set_title("Gtkmm-PLplot test2");
canvas.set_hexpand(true);
canvas.set_vexpand(true);
canvas.set_focusable(true);
Gtk::AspectFrame geometry(Gtk::Align::CENTER, Gtk::Align::CENTER, float(width)/float(height), false);
geometry.set_child(canvas);
x_log_switch.set_active(plot->get_axis_logarithmic_x());
y_log_switch.set_active(plot->get_axis_logarithmic_y());
x_log_switch.property_active().signal_changed().connect([this, plot](){
if (x_log_switch.get_active()) {
plot->set_axis_logarithmic_x(true);
}
else {
plot->set_axis_logarithmic_x(false);
}
});
legend_switch.set_active(plot->is_showing_legend());
legend_switch.property_active().signal_changed().connect([this, plot](){
if (legend_switch.get_active()) {
plot->show_legend();
}
else {
plot->hide_legend();
}
});
box_combo.append("No box, no ticks, no labels, no axes");
box_combo.append("Box only");
box_combo.append("Box, ticks and tick labels");
box_combo.append("Box, ticks, tick labels, and main axes");
box_combo.append("Box, ticks, tick labels, main axes and major tick grid");
box_combo.append("Box, ticks, tick labels, main axes and major and minor tick grid");
box_combo.signal_changed().connect(
[this, plot](){
box_combo.get_active_row_number() - 2
));
}
);
box_combo.set_active(plot->get_box_style() + 2);
corner_combo.append("Top-right");
corner_combo.append("Bottom-right");
corner_combo.append("Top-left");
corner_combo.append("Bottom-left");
corner_combo.signal_changed().connect(
[this, plot](){
corner_combo.get_active_row_number()
));
}
);
corner_combo.set_active(plot->get_legend_corner_position());
y_log_switch.property_active().signal_changed().connect([this, plot](){
if (y_log_switch.get_active()) {
plot->set_axis_logarithmic_y(true);
}
else {
plot->set_axis_logarithmic_y(false);
}
});
text_entry.signal_changed().connect([this](){
plot_text2d.set_text(text_entry.get_text());
});
text_color_button.signal_color_set().connect([this](){
plot_text2d.set_color(text_color_button.get_rgba());
});
text_justification_spin_button.signal_value_changed().connect([this](){
plot_text2d.set_justification(text_justification_spin_button.get_value());
});
text_scale_factor_spin_button.signal_value_changed().connect([this](){
plot_text2d.set_scale_factor(text_scale_factor_spin_button.get_value());
});
text_orientation_switch.property_active().signal_changed().connect([this](){
if (text_orientation_switch.get_active()) {
plot_text2d.set_orientation(Gtk::Orientation::VERTICAL);
}
else {
plot_text2d.set_orientation(Gtk::Orientation::HORIZONTAL);
}
});
text_orientation_switch.set_active(false);
x_log_label.set_halign(Gtk::Align::END);
y_log_label.set_halign(Gtk::Align::END);
box_label.set_halign(Gtk::Align::END);
corner_label.set_halign(Gtk::Align::END);
legend_label.set_halign(Gtk::Align::END);
x_log_switch.set_halign(Gtk::Align::START);
y_log_switch.set_halign(Gtk::Align::START);
box_combo.set_halign(Gtk::Align::START);
corner_combo.set_halign(Gtk::Align::START);
legend_switch.set_halign(Gtk::Align::START);
text_label.set_halign(Gtk::Align::END);
text_entry.set_halign(Gtk::Align::START);
text_color_label.set_halign(Gtk::Align::END);
text_color_button.set_halign(Gtk::Align::START);
text_justification_label.set_halign(Gtk::Align::END);
text_justification_spin_button.set_halign(Gtk::Align::START);
text_scale_factor_label.set_halign(Gtk::Align::END);
text_scale_factor_spin_button.set_halign(Gtk::Align::START);
text_orientation_label.set_halign(Gtk::Align::END);
text_orientation_switch.set_halign(Gtk::Align::START);
grid.attach(x_log_label, 0, 0, 1, 1);
grid.attach(y_log_label, 0, 1, 1, 1);
grid.attach(legend_label, 0, 2, 1, 1);
grid.attach(x_log_switch, 1, 0, 1, 1);
grid.attach(y_log_switch, 1, 1, 1, 1);
grid.attach(legend_switch, 1, 2, 1, 1);
grid.attach(corner_label, 0, 3, 1, 1);
grid.attach(corner_combo, 1, 3, 1, 1);
grid.attach(box_label, 0, 4, 1, 1);
grid.attach(box_combo, 1, 4, 1, 1);
grid.attach(text_label, 2, 0, 1, 1);
grid.attach(text_entry, 3, 0, 1, 1);
grid.attach(text_color_label, 2, 1, 1, 1);
grid.attach(text_color_button, 3, 1, 1, 1);
grid.attach(text_justification_label, 2, 2, 1, 1);
grid.attach(text_justification_spin_button, 3, 2, 1, 1);
grid.attach(text_scale_factor_label, 2, 3, 1, 1);
grid.attach(text_scale_factor_spin_button, 3, 3, 1, 1);
grid.attach(text_orientation_label, 2, 4, 1, 1);
grid.attach(text_orientation_switch, 3, 4, 1, 1);
grid.attach(geometry, 0, 5, 4, 1);
grid.set_column_spacing(5);
grid.set_column_homogeneous(false);
grid.set_margin(10);
set_child(grid);
}
virtual ~Window() {}
};
}
int main(int argc, char *argv[]) {
Glib::set_application_name("gtkmm-plplot-test2");
Glib::RefPtr<Gtk::Application> app = Gtk::Application::create("eu.tomschoonjans.gtkmm-plplot-test2");
//open our test file
std::ifstream fs;
fs.exceptions(std::ifstream::failbit | std::ifstream::badbit | std::ifstream::eofbit);
try {
fs.open(TEST_CSV);
}
catch (std::exception &e) {
std::cerr << "Error opening file " << TEST_CSV << " -> " << e.what() << std::endl;
return 1;
}
std::vector<double> x;
std::vector<double> y1, y2, y3, y4;
while (1) {
try {
fs.clear();
std::string line;
std::getline(fs, line);
gchar **splitted = g_strsplit(line.c_str(), ",", 0);
x.push_back(g_ascii_strtod(splitted[1], NULL));
y1.push_back(g_ascii_strtod(splitted[2], NULL));
y2.push_back(g_ascii_strtod(splitted[3], NULL));
y3.push_back(g_ascii_strtod(splitted[4], NULL));
y4.push_back(g_ascii_strtod(splitted[5], NULL));
g_strfreev(splitted);
}
catch (std::exception &e) {
if (fs.eof()) {
break;
}
std::cerr << "Error parsing " << TEST_CSV << " -> " << e.what() << std::endl;
return 1;
}
catch (...) {
std::cerr << "Unknown exception occurred" << std::endl;
return 1;
}
}
//ensure our y-values are greater than 1!
//the x-values are already...
std::for_each(std::begin(y1), std::end(y1), [](double &a) { if (a < 1.0 ) a = 1.0;});
std::for_each(std::begin(y2), std::end(y2), [](double &a) { if (a < 1.0 ) a = 1.0;});
std::for_each(std::begin(y3), std::end(y3), [](double &a) { if (a < 1.0 ) a = 1.0;});
std::for_each(std::begin(y4), std::end(y4), [](double &a) { if (a < 1.0 ) a = 1.0;});
Glib::ustring x_title("Energy (keV)"), y_title("Intensity (counts)"), plot_title("NIST SRM 1155 Stainless steel");
return app->make_window_and_run<Test2::Window>(argc, argv, x, y1, y2, y3, y4, x_title, y_title, plot_title);
}
void add_plot(Plot &plot)
bool is_showing_legend()
LegendCornerPosition get_legend_corner_position()
void set_legend_corner_position(LegendCornerPosition legend_corner_position)
void set_box_style(BoxStyle style=BOX_TICKS_TICK_LABELS)
bool get_axis_logarithmic_x()
bool get_axis_logarithmic_y()
BoxStyle get_box_style()
void set_axis_logarithmic_y(bool log10=true)
void set_name(Glib::ustring name)
void set_color(Gdk::RGBA color)
void set_scale_factor(double scale_factor)
void set_text(Glib::ustring text)
void set_justification(double justification)
Example 2
Example 3: Adding, removing, showing and hiding plots
/*
Copyright (C) 2015 Tom Schoonjans
This program is free software: you can redistribute it and/or modify
it under the terms of the GNU Lesser General Public License as published by
the Free Software Foundation, either version 3 of the License, or
(at your option) any later version.
This program is distributed in the hope that it will be useful,
but WITHOUT ANY WARRANTY; without even the implied warranty of
MERCHANTABILITY or FITNESS FOR A PARTICULAR PURPOSE. See the
GNU Lesser General Public License for more details.
You should have received a copy of the GNU Lesser General Public License
along with this program. If not, see <http://www.gnu.org/licenses/>.
*/
#include "gtkmm-plplot.h"
#include <gtkmm/application.h>
#include <gtkmm/aspectframe.h>
#include <glibmm/miscutils.h>
#include <gtkmm/window.h>
#include <gtkmm/grid.h>
#include <gtkmm/button.h>
#include <iostream>
#include <glib.h>
#ifndef M_PI
#define M_PI (3.14159265358979323846)
#endif
namespace Test3 {
class Window : public Gtk::Window {
private:
Gtk::PLplot::Canvas canvas;
Gtk::Grid grid;
Gtk::Button add_plot;
Gtk::Button remove_plot;
Gtk::Button show_plot;
Gtk::Button hide_plot;
Gtk::PLplot::Plot2D *plot;
void add_plot_clicked() {
add_plot.set_sensitive(false);
std::valarray<double> x_va(1000), y_va(1000);
for (unsigned int i = 0 ; i < 1000 ; i++) {
x_va[i] = 4*M_PI*i/999;
}
y_va = sin(x_va);
auto plot_data = Gtk::manage(new Gtk::PLplot::PlotData2D(x_va, y_va, Gdk::RGBA("blue"), Gtk::PLplot::LineStyle::LONG_DASH_LONG_GAP, 5.0));
plot = Gtk::manage(new Gtk::PLplot::Plot2D(*plot_data));
canvas.add_plot(*plot);
plot->hide_legend();
remove_plot.set_sensitive(true);
show_plot.set_sensitive(false);
hide_plot.set_sensitive(true);
}
public:
Window() : canvas(), add_plot("Add"), remove_plot("Remove"),
show_plot("Show"), hide_plot("Hide") {
const int width = 1024, height = 580;
set_default_size(width, height);
set_title("Gtkmm-PLplot test3");
canvas.set_hexpand(true);
canvas.set_vexpand(true);
canvas.set_focusable(true);
Gtk::AspectFrame geometry(Gtk::Align::CENTER, Gtk::Align::CENTER, float(width)/float(height), false);
geometry.set_child(canvas);
add_plot.set_hexpand(true);
add_plot.set_vexpand(false);
add_plot.set_halign(Gtk::Align::END);
remove_plot.set_hexpand(false);
remove_plot.set_vexpand(false);
show_plot.set_hexpand(false);
show_plot.set_vexpand(false);
hide_plot.set_hexpand(true);
hide_plot.set_vexpand(false);
hide_plot.set_halign(Gtk::Align::START);
remove_plot.set_sensitive(false);
show_plot.set_sensitive(false);
hide_plot.set_sensitive(false);
add_plot.signal_clicked().connect(sigc::mem_fun(*this, &Window::add_plot_clicked));
remove_plot.signal_clicked().connect([this](){
canvas.remove_plot(*plot);
add_plot.set_sensitive(true);
remove_plot.set_sensitive(false);
show_plot.set_sensitive(false);
hide_plot.set_sensitive(false);
});
show_plot.signal_clicked().connect([this](){
plot->show();
show_plot.set_sensitive(false);
hide_plot.set_sensitive(true);
});
hide_plot.signal_clicked().connect([this](){
plot->hide();
show_plot.set_sensitive(true);
hide_plot.set_sensitive(false);
});
grid.attach(add_plot, 0, 0, 1, 1);
grid.attach(remove_plot, 1, 0, 1, 1);
grid.attach(show_plot, 2, 0, 1, 1);
grid.attach(hide_plot, 3, 0, 1, 1);
grid.attach(geometry, 0, 1, 4, 1);
grid.set_row_spacing(5);
grid.set_column_spacing(5);
grid.set_column_homogeneous(false);
grid.set_margin(10);
set_child(grid);
}
virtual ~Window() {}
};
}
int main(int argc, char *argv[]) {
Glib::set_application_name("gtkmm-plplot-test3");
Glib::RefPtr<Gtk::Application> app = Gtk::Application::create("eu.tomschoonjans.gtkmm-plplot-test3");
return app->make_window_and_run<Test3::Window>(argc, argv);
}
void remove_plot(unsigned int plot_index)
void hide()
void show()
Example 3
Example 4: Displaying multiple plots on a single canvas
/*
Copyright (C) 2015 Tom Schoonjans
This program is free software: you can redistribute it and/or modify
it under the terms of the GNU Lesser General Public License as published by
the Free Software Foundation, either version 3 of the License, or
(at your option) any later version.
This program is distributed in the hope that it will be useful,
but WITHOUT ANY WARRANTY; without even the implied warranty of
MERCHANTABILITY or FITNESS FOR A PARTICULAR PURPOSE. See the
GNU Lesser General Public License for more details.
You should have received a copy of the GNU Lesser General Public License
along with this program. If not, see <http://www.gnu.org/licenses/>.
*/
#include <gtkmm-plplot.h>
#include <gtkmm/application.h>
#include <gtkmm/aspectframe.h>
#include <glibmm/miscutils.h>
#include <glibmm/stringutils.h>
#include <gtkmm/window.h>
#include <gtkmm/grid.h>
#include <gtkmm/checkbutton.h>
#include <gtkmm/label.h>
#include <gtkmm/entry.h>
#include <iostream>
#include <glib.h>
#include <cmath>
namespace Test4 {
class CheckButton : public Gtk::CheckButton {
private:
//we are not using any methods specific to Plot2D, so we can safely use Plot here
Gtk::PLplot::Plot2D *plot;
public:
CheckButton(Glib::ustring text) : Gtk::CheckButton(text), plot(nullptr) {}
void on_toggled() final {
if (!plot)
return;
if (get_active())
plot->show();
else
plot->hide();
}
void connect_plot(Gtk::PLplot::Plot2D *_plot) {
plot = _plot;
plot->hide_legend();
}
};
class Window : public Gtk::Window {
private:
Gtk::PLplot::Canvas canvas;
Gtk::Grid grid;
Test4::CheckButton checkbutton1;
Test4::CheckButton checkbutton2;
Test4::CheckButton checkbutton3;
Gtk::Grid coordinates_grid;
Gtk::Label label_x;
Gtk::Label label_y;
Gtk::Entry entry_x;
Gtk::Entry entry_y;
public:
Window() : canvas(), checkbutton1("Plot 1"),
checkbutton2("Plot 2"), checkbutton3("Plot 3"),
label_x("X:"),
label_y("Y:") {
const int width = 1024, height = 580;
set_default_size(width, height);
set_title("Gtkmm-PLplot test4");
canvas.set_hexpand(true);
canvas.set_vexpand(true);
canvas.set_focusable(true);
canvas.set_background_color(Gdk::RGBA("Light Gray"));
Gtk::AspectFrame geometry(Gtk::Align::CENTER, Gtk::Align::CENTER, float(width)/float(height), false);
geometry.set_child(canvas);
grid.set_column_homogeneous(true);
checkbutton1.set_vexpand(false);
checkbutton1.set_hexpand(false);
checkbutton1.set_halign(Gtk::Align::CENTER);
checkbutton2.set_vexpand(false);
checkbutton2.set_hexpand(false);
checkbutton2.set_halign(Gtk::Align::CENTER);
checkbutton3.set_vexpand(false);
checkbutton3.set_hexpand(false);
checkbutton3.set_halign(Gtk::Align::CENTER);
std::valarray<double> x_va = Gtk::PLplot::indgen_va(1000)/50.0 - 10.0;
std::valarray<double> y_va1 = sinh(x_va);
std::valarray<double> y_va2 = cosh(x_va);
std::valarray<double> y_va3 = tanh(x_va);
//generate the data, the plot, add them to the canvas and use the return value to pass it to the checkbutton
Gtk::PLplot::Plot2D *plot1 = Gtk::manage(
new Gtk::PLplot::Plot2D(
*Gtk::manage(
x_va,
y_va1,
Gdk::RGBA("blue"),
3.0
)
),
"X-axis",
"Y-axis",
"Hyperbolic sine",
0.5,
0.5,
0.0,
0.0
)
);
canvas.add_plot(*plot1);
checkbutton1.connect_plot(plot1);
Gtk::PLplot::Plot2D *plot2 = Gtk::manage(
new Gtk::PLplot::Plot2D(
*Gtk::manage(
x_va,
y_va2,
Gdk::RGBA("red"),
3.0
)
),
"X-axis",
"Y-axis",
"Hyperbolic cosine",
0.5,
0.5,
0.5,
0.0
)
);
canvas.add_plot(*plot2);
checkbutton2.connect_plot(plot2);
Gtk::PLplot::Plot2D *plot3 = Gtk::manage(
new Gtk::PLplot::Plot2D(
*Gtk::manage(
x_va,
y_va3,
Gdk::RGBA("green"),
3.0
)
),
"X-axis",
"Y-axis",
"Hyperbolic tangent",
0.4,
0.4,
0.2,
0.55
)
);
canvas.add_plot(*plot3);
checkbutton3.connect_plot(plot3);
checkbutton1.set_active();
checkbutton2.set_active(false);
checkbutton3.set_active();
//let's make the first plot unpannable
plot1->set_region_pannable(false);
//let's override the background color of the second plot and hide it to make the surprise complete!!
plot2->set_background_color(Gdk::RGBA("Yellow Green"));
plot2->hide();
//also let's disable the region selection, for no reason whatsoever!
plot2->set_region_selectable(false);
//let's override the default region of this plot, this is NOT influenced by set_region_selectable()!!!
plot2->set_region(-10, 10, -10, 10);
//we can also change some other colors
plot2->set_axes_color(Gdk::RGBA("Blue"));
plot2->set_titles_color(Gdk::RGBA("Purple"));
//lets'give the third plot a nice opaque background color
plot3->set_background_color(Gdk::RGBA("White"));
//but disable zooming by scrolling
plot3->set_region_zoomable(false);
//and give it an unusual selection box
plot3->set_region_selection_color(Gdk::RGBA("Purple"));
plot3->set_region_selection_width(4.0);
//hook up signal_cursor_motion to the entries
unsigned int plotnr = 0;
while (1) {
try {
entry_x.set_text(Glib::Ascii::dtostr(x));
entry_y.set_text(Glib::Ascii::dtostr(y));
});
}
catch (Gtk::PLplot::Exception &e) {
break;
}
}
grid.attach(checkbutton1, 0, 0, 1, 1);
grid.attach(checkbutton2, 1, 0, 1, 1);
grid.attach(checkbutton3, 2, 0, 1, 1);
grid.attach(geometry, 0, 1, 3, 1);
coordinates_grid.set_column_homogeneous(false);
coordinates_grid.attach(label_x, 0, 0, 1, 1);
coordinates_grid.attach(entry_x, 1, 0, 1, 1);
coordinates_grid.attach(label_y, 2, 0, 1, 1);
coordinates_grid.attach(entry_y, 3, 0, 1, 1);
label_x.set_vexpand(false);
label_x.set_hexpand(true);
label_x.set_halign(Gtk::Align::END);
label_y.set_vexpand(false);
label_y.set_hexpand(false);
label_y.set_halign(Gtk::Align::CENTER);
entry_x.set_vexpand(false);
entry_x.set_hexpand(false);
entry_x.set_halign(Gtk::Align::END);
entry_y.set_vexpand(false);
entry_y.set_hexpand(true);
entry_y.set_halign(Gtk::Align::START);
coordinates_grid.set_column_spacing(5);
grid.attach(coordinates_grid, 0, 2, 3, 1);
grid.set_row_spacing(5);
grid.set_margin(10);
set_child(grid);
}
virtual ~Window() {}
};
}
int main(int argc, char *argv[]) {
Glib::set_application_name("gtkmm-plplot-test4");
Glib::RefPtr<Gtk::Application> app = Gtk::Application::create("eu.tomschoonjans.gtkmm-plplot-test4");
return app->make_window_and_run<Test4::Window>(argc, argv);
}
void set_background_color(Gdk::RGBA color)
Plot * get_plot(unsigned int plot_index)
void set_axes_color(Gdk::RGBA color)
void set_background_color(Gdk::RGBA color)
void set_titles_color(Gdk::RGBA color)
void set_region_pannable(bool pannable=true)
void set_region_selection_width(double line_width)
void set_region(double xmin, double xmax, double ymin, double ymax)
void set_region_zoomable(bool zoomable=true)
void set_region_selectable(bool selectable=true)
void set_region_selection_color(Gdk::RGBA color)
sigc::signal< void(double, double)> signal_cursor_motion()
Definition regionselection.h:361
std::valarray< double > indgen_va(unsigned int n)
@ BOX_TICKS_TICK_LABELS_MAIN_AXES_MAJOR_MINOR_TICK_GRID
also draw a grid at minor tick positions in both coordinates
Definition enums.h:49
@ CONTINUOUS
a continuous, uninterrupted line will be drawn
Definition enums.h:29
Example 4
Example 5: Mixing plot lines and symbols plus adding datapoints
/*
Copyright (C) 2015 Tom Schoonjans
This program is free software: you can redistribute it and/or modify
it under the terms of the GNU Lesser General Public License as published by
the Free Software Foundation, either version 3 of the License, or
(at your option) any later version.
This program is distributed in the hope that it will be useful,
but WITHOUT ANY WARRANTY; without even the implied warranty of
MERCHANTABILITY or FITNESS FOR A PARTICULAR PURPOSE. See the
GNU Lesser General Public License for more details.
You should have received a copy of the GNU Lesser General Public License
along with this program. If not, see <http://www.gnu.org/licenses/>.
*/
#include <gtkmm-plplot.h>
#include <gtkmm/application.h>
#include <gtkmm/aspectframe.h>
#include <glibmm/miscutils.h>
#include <glib.h>
#include <gtkmm/window.h>
#include <gtkmm/switch.h>
#include <gtkmm/grid.h>
#include <gtkmm/spinbutton.h>
#include <gtkmm/colorbutton.h>
#include <gtkmm/label.h>
#include <gtkmm/comboboxtext.h>
#include <random>
namespace Test5 {
class Window : public Gtk::Window {
private:
Gtk::PLplot::Canvas canvas;
Gtk::Grid grid;
Gtk::Label line_label;
Gtk::Label symbol_label;
Gtk::ComboBoxText linestyle_combo;
Gtk::Entry symbol_entry;
Gtk::ColorButton line_color;
Gtk::ColorButton symbol_color;
Glib::RefPtr<Gtk::Adjustment> linewidth_adj;
Glib::RefPtr<Gtk::Adjustment> symbol_scale_factor_adj;
Gtk::SpinButton linewidth_spin;
Gtk::SpinButton symbol_scale_factor_spin;
Gtk::Button add_data_button;
Gtk::Button remove_data_button;
public:
Window(std::valarray<double> &x, std::valarray<double> &y,
Glib::ustring x_title = "X-axis", Glib::ustring y_title = "Y-axis",
Glib::ustring plot_title = "y = sqrt(x)", Gdk::RGBA color = Gdk::RGBA("Blue")) :
canvas(*Gtk::manage(new Gtk::PLplot::Plot2D(*Gtk::manage(new Gtk::PLplot::PlotData2D(x, y, color)), x_title, y_title, plot_title))),
line_label("Line"), symbol_label("Symbols"),
linewidth_adj(Gtk::Adjustment::create(1.0, 0.1, 10.0, 0.1, 1.0, 0.0)),
symbol_scale_factor_adj(Gtk::Adjustment::create(1.0, 0.1, 10.0, 0.1, 1.0, 0.0)),
linewidth_spin(linewidth_adj, 0.1, 1.0),
symbol_scale_factor_spin(symbol_scale_factor_adj, 0.1, 1.0),
add_data_button("Append datapoint"),
remove_data_button("Remove random datapoint") {
// general window and canvas settings
const int width = 1024, height = 580;
set_default_size(width, height);
set_title("Gtkmm-PLplot test5");
canvas.set_hexpand(true);
canvas.set_vexpand(true);
canvas.set_focusable(true);
Gtk::AspectFrame geometry(Gtk::Align::CENTER, Gtk::Align::CENTER, float(width)/float(height), false);
geometry.set_child(canvas);
// grid options
grid.set_column_homogeneous(false);
grid.set_column_spacing(5);
grid.set_row_homogeneous(false);
grid.set_row_spacing(5);
//the labels
line_label.set_hexpand(true);
line_label.set_vexpand(false);
line_label.set_valign(Gtk::Align::CENTER);
line_label.set_halign(Gtk::Align::END);
symbol_label.set_hexpand(true);
symbol_label.set_vexpand(false);
symbol_label.set_valign(Gtk::Align::CENTER);
symbol_label.set_halign(Gtk::Align::END);
grid.attach(line_label, 0, 0, 1, 1);
grid.attach(symbol_label, 0, 1, 1, 1);
//the color buttons
line_color.set_rgba(plot_data->get_color());
symbol_color.set_rgba(plot_data->get_symbol_color());
line_color.set_use_alpha(true);
symbol_color.set_use_alpha(true);
line_color.set_hexpand(false);
line_color.set_vexpand(false);
symbol_color.set_hexpand(false);
symbol_color.set_vexpand(false);
line_color.set_halign(Gtk::Align::CENTER);
line_color.set_valign(Gtk::Align::CENTER);
symbol_color.set_halign(Gtk::Align::CENTER);
symbol_color.set_valign(Gtk::Align::CENTER);
line_color.signal_color_set().connect([this, plot_data](){plot_data->set_color(line_color.get_rgba());});
symbol_color.signal_color_set().connect([this, plot_data](){plot_data->set_symbol_color(symbol_color.get_rgba());});
grid.attach(line_color, 1, 0, 1, 1);
grid.attach(symbol_color, 1, 1, 1, 1);
//the linestyle comboboxtext
linestyle_combo.append("none");
linestyle_combo.append("continuous");
linestyle_combo.append("short dash short gap");
linestyle_combo.append("long dash long gap");
linestyle_combo.append("long dash short gap");
linestyle_combo.append("long dash short gap short dash short gap");
linestyle_combo.append("long dash short gap long dash short gap");
linestyle_combo.set_active(plot_data->get_line_style());
linestyle_combo.signal_changed().connect([this, plot_data](){plot_data->set_line_style(static_cast<Gtk::PLplot::LineStyle>(linestyle_combo.get_active_row_number()));});
linestyle_combo.set_hexpand(false);
linestyle_combo.set_vexpand(false);
linestyle_combo.set_halign(Gtk::Align::CENTER);
linestyle_combo.set_valign(Gtk::Align::CENTER);
grid.attach(linestyle_combo, 2, 0, 1, 1);
//the symbol
plot_data->set_symbol("√");
symbol_entry.set_text(plot_data->get_symbol());
symbol_entry.set_hexpand(false);
symbol_entry.set_vexpand(false);
symbol_entry.set_halign(Gtk::Align::FILL);
symbol_entry.set_valign(Gtk::Align::CENTER);
symbol_entry.signal_changed().connect([this, plot_data](){
plot_data->set_symbol(
symbol_entry.get_text()
);
});
grid.attach(symbol_entry, 2, 1, 1, 1);
//our spinbuttons, first one for the line thickness, second for symbol size
linewidth_spin.set_hexpand(true);
linewidth_spin.set_vexpand(false);
linewidth_spin.set_halign(Gtk::Align::START);
linewidth_spin.set_valign(Gtk::Align::CENTER);
linewidth_spin.set_wrap(true);
linewidth_spin.set_snap_to_ticks(true);
linewidth_spin.set_numeric(true);
symbol_scale_factor_spin.set_hexpand(true);
symbol_scale_factor_spin.set_vexpand(false);
symbol_scale_factor_spin.set_halign(Gtk::Align::START);
symbol_scale_factor_spin.set_valign(Gtk::Align::CENTER);
linewidth_spin.set_value(plot_data->get_line_width());
symbol_scale_factor_spin.set_value(plot_data->get_symbol_height_scale_factor());
linewidth_spin.signal_value_changed().connect([this, plot_data](){plot_data->set_line_width(linewidth_spin.get_value());});
symbol_scale_factor_spin.signal_value_changed().connect([this, plot_data](){plot_data->set_symbol_height_scale_factor(symbol_scale_factor_spin.get_value());});
grid.attach(linewidth_spin, 3, 0, 1, 1);
grid.attach(symbol_scale_factor_spin, 3, 1, 1, 1);
Gtk::Grid *buttons_grid = Gtk::manage(new Gtk::Grid());
buttons_grid->set_column_homogeneous(true);
buttons_grid->set_column_spacing(5);
grid.attach(*buttons_grid, 0, 3, 4, 1);
//the add datapoint button
add_data_button.set_hexpand(false);
add_data_button.set_vexpand(false);
add_data_button.set_valign(Gtk::Align::CENTER);
add_data_button.set_halign(Gtk::Align::END);
buttons_grid->attach(add_data_button, 0, 0, 1, 1);
add_data_button.signal_clicked().connect([this, plot_data](){
//this lambda has a static variable that will keep our ever incrementing X-value
static double new_x = 0.0;
plot_data->add_datapoint(new_x, sqrt(new_x));
new_x += 1.0;
remove_data_button.set_sensitive(true);
});
remove_data_button.set_hexpand(false);
remove_data_button.set_vexpand(false);
remove_data_button.set_valign(Gtk::Align::CENTER);
remove_data_button.set_halign(Gtk::Align::START);
remove_data_button.set_sensitive(false);
buttons_grid->attach(remove_data_button, 1, 0, 1, 1);
remove_data_button.signal_clicked().connect([this, plot_data](){
static std::default_random_engine rng;
unsigned long int size = plot_data->size();
if (size == 1) {
plot_data->remove_datapoint(0);
remove_data_button.set_sensitive(false);
}
else {
std::uniform_int_distribution<unsigned long int> dist(0, size - 1);
plot_data->remove_datapoint(dist(rng));
}
});
//finishing up
grid.attach(geometry, 0, 2, 4, 1);
grid.set_margin(10);
set_child(grid);
}
virtual ~Window() {}
};
}
int main(int argc, char **argv) {
Glib::set_application_name("gtkmm-plplot-test5");
Glib::RefPtr<Gtk::Application> app = Gtk::Application::create("eu.tomschoonjans.gtkmm-plplot-test5");
std::valarray<double> x_va, y_va;
return app->make_window_and_run<Test5::Window>(argc, argv, x_va, y_va);
}
Example 5
Example 6: Polar coordinate systems
/*
Copyright (C) 2015-2019 Tom Schoonjans
This program is free software: you can redistribute it and/or modify
it under the terms of the GNU Lesser General Public License as published by
the Free Software Foundation, either version 3 of the License, or
(at your option) any later version.
This program is distributed in the hope that it will be useful,
but WITHOUT ANY WARRANTY; without even the implied warranty of
MERCHANTABILITY or FITNESS FOR A PARTICULAR PURPOSE. See the
GNU Lesser General Public License for more details.
You should have received a copy of the GNU Lesser General Public License
along with this program. If not, see <http://www.gnu.org/licenses/>.
*/
#include <gtkmm-plplot.h>
#include <gtkmm/application.h>
#include <gtkmm/aspectframe.h>
#include <glibmm/miscutils.h>
#include <glib.h>
#include <gtkmm/window.h>
#include <gtkmm/switch.h>
#include <gtkmm/grid.h>
#include <gtkmm/spinbutton.h>
#include <gtkmm/colorbutton.h>
#include <gtkmm/label.h>
#include <gtkmm/comboboxtext.h>
#include <cmath>
#ifndef M_PI
#define M_PI (3.14159265358979323846)
#endif
namespace Test6 {
class Window : public Gtk::Window {
private:
Gtk::PLplot::Canvas canvas;
Gtk::Grid grid;
std::valarray<double> theta3;
std::valarray<double> r3;
Gtk::Button button;
public:
Window() : theta3(Gtk::PLplot::indgen_va(2000)*2.0*M_PI/1999.0), r3(2.0 * sin(4.0 * theta3 )), button("Replace Fermat's Spiral with Polar Rose") {
// general window and canvas settings
const int width = 720, height = 720;
set_default_size(width, height);
set_title("Gtkmm-PLplot test6");
canvas.set_hexpand(true);
canvas.set_vexpand(true);
canvas.set_focusable(true);
Gtk::AspectFrame geometry(Gtk::Align::CENTER, Gtk::Align::CENTER, float(width)/float(height), false);
geometry.set_child(canvas);
//add a plot to canvas
//a cardioid
std::valarray<double> theta1 = Gtk::PLplot::indgen_va(1000)*2.0*M_PI/999.0;
std::valarray<double> r1 = cos(theta1) + double(1.0);
*Gtk::manage(new Gtk::PLplot::PlotDataPolar(r1, theta1, Gdk::RGBA("red"), Gtk::PLplot::LineStyle::CONTINUOUS, 2.0)),
"",
"",
"Polar coordinate system"
));
//Fermat's spiral
std::valarray<double> theta2 = Gtk::PLplot::indgen_va(2000)*4.0*M_PI/1999.0;
std::valarray<double> r2 = sqrt(theta2) * 2.0 / sqrt(M_PI) * 1.1;
auto data2 = Gtk::manage(new Gtk::PLplot::PlotDataPolar(r2, theta2, Gdk::RGBA("green"), Gtk::PLplot::LineStyle::CONTINUOUS, 2.0));
data2->set_name("Fermat's Spiral");
canvas.add_plot(*plot);
plot->add_data(*data2);
grid.attach(geometry, 0, 0, 1, 1);
button.set_hexpand(false);
button.set_vexpand(false);
button.set_halign(Gtk::Align::CENTER);
button.set_vexpand(false);
button.signal_clicked().connect([this, data2](){
data2->set_name("Polar Rose");
data2->replace_datapoints(r3, theta3);
button.set_sensitive(false);
});
grid.attach(button, 0, 1, 1, 1);
grid.set_margin(10);
set_child(grid);
}
virtual ~Window() {}
};
}
int main(int argc, char **argv) {
Glib::set_application_name("gtkmm-plplot-test6");
Glib::RefPtr<Gtk::Application> app = Gtk::Application::create("eu.tomschoonjans.gtkmm-plplot-test6");
return app->make_window_and_run<Test6::Window>(argc, argv);
}
a class that will hold a single dataset and its properties for a PlotPolar plot
Definition plotdatapolar.h:42
Example 6
Example 7: a Simple contour plot
/*
Copyright (C) 2015 Tom Schoonjans
This program is free software: you can redistribute it and/or modify
it under the terms of the GNU Lesser General Public License as published by
the Free Software Foundation, either version 3 of the License, or
(at your option) any later version.
This program is distributed in the hope that it will be useful,
but WITHOUT ANY WARRANTY; without even the implied warranty of
MERCHANTABILITY or FITNESS FOR A PARTICULAR PURPOSE. See the
GNU Lesser General Public License for more details.
You should have received a copy of the GNU Lesser General Public License
along with this program. If not, see <http://www.gnu.org/licenses/>.
*/
#include <gtkmm-plplot.h>
#include <gtkmm/application.h>
#include <gtkmm/aspectframe.h>
#include <glibmm/miscutils.h>
#include <glib.h>
#include <gtkmm/window.h>
#include <gtkmm/grid.h>
#include <gtkmm/spinbutton.h>
#include <gtkmm/colorbutton.h>
#include <gtkmm/label.h>
#include <gtkmm/comboboxtext.h>
#include <cmath>
#include <fstream>
#include <iostream>
#include <sstream>
namespace Test7 {
class Window : public Gtk::Window {
private:
Gtk::PLplot::Canvas canvas;
Gtk::Grid grid;
Gtk::Label edge_label;
Gtk::ColorButton edge_color;
Glib::RefPtr<Gtk::Adjustment> edge_width_adj;
Gtk::SpinButton edge_width_spin;
Gtk::Label nlevels_label;
Glib::RefPtr<Gtk::Adjustment> nlevels_adj;
Gtk::SpinButton nlevels_spin;
public:
Window() :
edge_label("Contour edge properties"),
edge_color(Gdk::RGBA("Red")),
edge_width_adj(Gtk::Adjustment::create(1.0, 0.1, 10.0, 0.1, 1.0, 0.0)),
edge_width_spin(edge_width_adj, 0.1, 1),
nlevels_label("Number of contour edges"),
nlevels_adj(Gtk::Adjustment::create(7, 3, 20, 1, 5)),
nlevels_spin(nlevels_adj, 1, 0)
{
Glib::ustring x_title = "X-axis";
Glib::ustring y_title = "Y-axis";
Glib::ustring plot_title = "Intensity vs detector position";
// general window and canvas settings
const int width = 1024, height = 720;
set_default_size(width, height);
set_title("Gtkmm-PLplot test7");
canvas.set_hexpand(true);
canvas.set_vexpand(true);
canvas.set_focusable(true);
Gtk::AspectFrame geometry(Gtk::Align::CENTER, Gtk::Align::CENTER, float(width)/float(height), false);
geometry.set_child(canvas);
//read in our dataset
std::ifstream fs;
fs.exceptions(std::ifstream::failbit | std::ifstream::badbit | std::ifstream::eofbit);
// 11 x 11 dataset (I know the file layout and the data dimensions already)
const int nx = 11;
const int ny = 11;
std::vector<double> x(nx);
std::vector<double> y(ny);
#ifdef GTKMM_PLPLOT_BOOST_ENABLED
boost::multi_array<double, 2> z(boost::extents[nx][ny]);
std::cout << "Using Boost multi_array!" << std::endl;
#else
double **z = Gtk::PLplot::calloc_array2d(nx, ny);
#endif
fs.open(TEST_CSV);
std::string line;
std::getline(fs, line);
gchar **splitted = g_strsplit(line.c_str(), ",", 0);
//first line contains the x values
for (int i = 1 ; i < nx + 1 ; i++) {
x[i-1] = g_ascii_strtod(splitted[i], NULL);
}
g_strfreev(splitted);
for (int i = 0 ; i < ny ; i++) {
line.clear();
std::getline(fs, line);
splitted = g_strsplit(line.c_str(), ",", 0);
y[i] = g_ascii_strtod(splitted[0], NULL);
for (int j = 1 ; j < nx + 1 ; j++) {
z[j-1][i] = g_ascii_strtod(splitted[j], NULL);
}
g_strfreev(splitted);
}
//construct the plot
*Gtk::manage(new Gtk::PLplot::PlotDataSurface(x, y, z)),
x_title,
y_title,
plot_title,
7,
edge_color.get_rgba(),
1.0
));
canvas.add_plot(*plot);
//now let's set up the grid
grid.set_column_homogeneous(false);
grid.set_column_spacing(5);
grid.set_row_homogeneous(false);
grid.set_row_spacing(5);
edge_label.set_hexpand(true);
edge_label.set_vexpand(false);
edge_label.set_valign(Gtk::Align::CENTER);
edge_label.set_halign(Gtk::Align::END);
grid.attach(edge_label, 0, 0, 1, 1);
//color button
edge_color.set_rgba(plot->get_edge_color());
edge_color.set_use_alpha(true);
edge_color.set_hexpand(false);
edge_color.set_vexpand(false);
edge_color.set_halign(Gtk::Align::CENTER);
edge_color.set_valign(Gtk::Align::CENTER);
edge_color.signal_color_set().connect([this, plot](){plot->set_edge_color(edge_color.get_rgba());});
grid.attach(edge_color, 1, 0, 1, 1);
//the spinbutton
edge_width_spin.set_hexpand(true);
edge_width_spin.set_vexpand(false);
edge_width_spin.set_halign(Gtk::Align::START);
edge_width_spin.set_valign(Gtk::Align::CENTER);
edge_width_spin.set_wrap(true);
edge_width_spin.set_snap_to_ticks(true);
edge_width_spin.set_numeric(true);
edge_width_spin.set_value(plot->get_edge_width());
edge_width_spin.signal_value_changed().connect([this, plot](){
plot->set_edge_width(edge_width_spin.get_value());
});
grid.attach(edge_width_spin, 2, 0, 1, 1);
//add canvas to grid
grid.attach(geometry, 0, 1, 4, 1);
//nlevels
nlevels_label.set_hexpand(true);
nlevels_label.set_vexpand(false);
nlevels_label.set_valign(Gtk::Align::CENTER);
nlevels_label.set_halign(Gtk::Align::END);
nlevels_spin.set_hexpand(true);
nlevels_spin.set_vexpand(false);
nlevels_spin.set_halign(Gtk::Align::START);
nlevels_spin.set_valign(Gtk::Align::CENTER);
nlevels_spin.set_wrap(true);
nlevels_spin.set_snap_to_ticks(true);
nlevels_spin.set_numeric(true);
nlevels_spin.set_value(plot->get_nlevels());
nlevels_spin.signal_value_changed().connect([this, plot](){
plot->set_nlevels(nlevels_spin.get_value());
});
grid.attach(nlevels_label, 0, 2, 2, 1);
grid.attach(nlevels_spin, 2, 2, 2, 1);
//finishing up
grid.set_margin(10);
set_child(grid);
}
virtual ~Window() {}
};
}
int main(int argc, char **argv) {
Glib::set_application_name("gtkmm-plplot-test7");
Glib::RefPtr<Gtk::Application> app = Gtk::Application::create("eu.tomschoonjans.gtkmm-plplot-test7");
return app->make_window_and_run<Test7::Window>(argc, argv);
}
double ** calloc_array2d(int nx, int ny)
Example 7
Example 8: a Shaded contour plot
/*
Copyright (C) 2015 Tom Schoonjans
This program is free software: you can redistribute it and/or modify
it under the terms of the GNU Lesser General Public License as published by
the Free Software Foundation, either version 3 of the License, or
(at your option) any later version.
This program is distributed in the hope that it will be useful,
but WITHOUT ANY WARRANTY; without even the implied warranty of
MERCHANTABILITY or FITNESS FOR A PARTICULAR PURPOSE. See the
GNU Lesser General Public License for more details.
You should have received a copy of the GNU Lesser General Public License
along with this program. If not, see <http://www.gnu.org/licenses/>.
*/
#include <gtkmm-plplot.h>
#include <gtkmm/application.h>
#include <gtkmm/aspectframe.h>
#include <glibmm/miscutils.h>
#include <glib.h>
#include <gtkmm/window.h>
#include <gtkmm/grid.h>
#include <gtkmm/spinbutton.h>
#include <gtkmm/colorbutton.h>
#include <gtkmm/label.h>
#include <gtkmm/comboboxtext.h>
#include <gtkmm/switch.h>
#include <gtkmm/paned.h>
#include <gtkmmconfig.h>
#include <cmath>
#include <fstream>
#include <iostream>
#include <sstream>
namespace Test8 {
class Window : public Gtk::Window {
private:
Gtk::PLplot::Canvas canvas;
Gtk::Grid grid;
Gtk::Label show_edges_label;
Gtk::Switch show_edges_switch;
Gtk::Label show_labels_label;
Gtk::Switch show_labels_switch;
Gtk::Label edge_color_label;
Gtk::ColorButton edge_color;
Gtk::Label edge_width_label;
Glib::RefPtr<Gtk::Adjustment> edge_width_adj;
Gtk::SpinButton edge_width_spin;
Gtk::Label nlevels_label;
Glib::RefPtr<Gtk::Adjustment> nlevels_adj;
Gtk::SpinButton nlevels_spin;
Gtk::Label colormap_palette_label;
Gtk::ComboBoxText colormap_palette_combo;
Gtk::Label area_fill_pattern_label;
Gtk::ComboBoxText area_fill_pattern_combo;
Gtk::Label area_lines_width_label;
Glib::RefPtr<Gtk::Adjustment> area_lines_width_adj;
Gtk::SpinButton area_lines_width_spin;
Gtk::Label colorbar_label;
Gtk::Switch colorbar_switch;
Gtk::Paned paned;
Gtk::AspectFrame aspect_frame;
public:
Window() :
show_edges_label("Show edges"),
show_labels_label("Show contour labels"),
edge_color_label("Contour edge color"),
edge_color(Gdk::RGBA("Red")),
edge_width_label("Contour edge width"),
edge_width_adj(Gtk::Adjustment::create(1.0, 0.1, 10.0, 0.1, 1.0, 0.0)),
edge_width_spin(edge_width_adj, 0.1, 1),
nlevels_label("Number of contour edges"),
nlevels_adj(Gtk::Adjustment::create(7, 3, 20, 1, 5)),
nlevels_spin(nlevels_adj, 1, 0),
colormap_palette_label("Colormap palette"),
area_fill_pattern_label("Fill pattern"),
area_lines_width_label("Fill pattern width"),
area_lines_width_adj(Gtk::Adjustment::create(1.0, 0.1, 10.0, 0.1, 1.0, 0.0)),
area_lines_width_spin(area_lines_width_adj, 0.1, 1),
colorbar_label("Show colorbar"),
paned(Gtk::Orientation::VERTICAL),
{
Glib::ustring x_title = "X-axis";
Glib::ustring y_title = "Y-axis";
Glib::ustring plot_title = "Intensity vs detector position";
// general window and canvas settings
const int width = 720, height = 720;
set_default_size(width, height);
set_title("Gtkmm-PLplot test8");
canvas.set_hexpand(true);
canvas.set_vexpand(true);
canvas.set_focusable(true);
//read in our dataset
std::ifstream fs;
fs.exceptions(std::ifstream::failbit | std::ifstream::badbit | std::ifstream::eofbit);
// 11 x 11 dataset (I know the file layout and the data dimensions already)
const int nx = 11;
const int ny = 11;
std::vector<double> x(nx);
std::vector<double> y(ny);
#ifdef GTKMM_PLPLOT_BOOST_ENABLED
boost::multi_array<double, 2> z(boost::extents[nx][ny]);
std::cout << "Using Boost multi_array!" << std::endl;
#else
double **z = Gtk::PLplot::calloc_array2d(nx, ny);
#endif
fs.open(TEST_CSV);
std::string line;
std::getline(fs, line);
gchar **splitted = g_strsplit(line.c_str(), ",", 0);
//first line contains the x values
for (int i = 1 ; i < nx + 1 ; i++) {
x[i-1] = g_ascii_strtod(splitted[i], NULL);
}
g_strfreev(splitted);
for (int i = 0 ; i < ny ; i++) {
line.clear();
std::getline(fs, line);
splitted = g_strsplit(line.c_str(), ",", 0);
y[i] = g_ascii_strtod(splitted[0], NULL);
for (int j = 1 ; j < nx + 1 ; j++) {
z[j-1][i] = g_ascii_strtod(splitted[j], NULL);
}
g_strfreev(splitted);
}
//construct the plot
*Gtk::manage(new Gtk::PLplot::PlotDataSurface(
x,
y,
z
)),
x_title,
y_title,
plot_title,
7,
edge_color.get_rgba(),
1.0
));
canvas.add_plot(*plot);
plot->set_background_color(Gdk::RGBA("Yellow Green"));
//now let's set up the grid
grid.set_column_homogeneous(true);
grid.set_column_spacing(5);
grid.set_row_homogeneous(false);
grid.set_row_spacing(5);
int row_counter = 0;
show_edges_label.set_hexpand(true);
show_edges_label.set_vexpand(false);
show_edges_label.set_valign(Gtk::Align::CENTER);
show_edges_label.set_halign(Gtk::Align::END);
show_edges_switch.set_hexpand(true);
show_edges_switch.set_vexpand(false);
show_edges_switch.set_halign(Gtk::Align::START);
show_edges_switch.set_valign(Gtk::Align::CENTER);
show_edges_switch.set_active(plot->is_showing_edges());
show_edges_switch.property_active().signal_changed().connect([this, plot](){
if (show_edges_switch.get_active()) {
edge_color.set_sensitive();
edge_width_spin.set_sensitive();
show_labels_switch.set_sensitive();
plot->show_edges();
}
else {
edge_color.set_sensitive(false);
edge_width_spin.set_sensitive(false);
show_labels_switch.set_sensitive(false);
plot->hide_edges();
}
});
grid.attach(show_edges_label, 0, row_counter, 1, 1);
grid.attach(show_edges_switch, 1, row_counter++, 1, 1);
// show contour labels
show_labels_label.set_hexpand(true);
show_labels_label.set_vexpand(false);
show_labels_label.set_valign(Gtk::Align::CENTER);
show_labels_label.set_halign(Gtk::Align::END);
show_labels_switch.set_hexpand(true);
show_labels_switch.set_vexpand(false);
show_labels_switch.set_halign(Gtk::Align::START);
show_labels_switch.set_valign(Gtk::Align::CENTER);
show_labels_switch.set_active(plot->is_showing_labels());
show_labels_switch.property_active().signal_changed().connect([this, plot](){
if (show_labels_switch.get_active()) {
plot->show_labels();
}
else {
plot->hide_labels();
}
});
grid.attach(show_labels_label, 0, row_counter, 1, 1);
grid.attach(show_labels_switch, 1, row_counter++, 1, 1);
//color button
edge_color_label.set_hexpand(true);
edge_color_label.set_vexpand(false);
edge_color_label.set_valign(Gtk::Align::CENTER);
edge_color_label.set_halign(Gtk::Align::END);
edge_color.set_rgba(plot->get_edge_color());
edge_color.set_use_alpha(true);
edge_color.set_hexpand(true);
edge_color.set_vexpand(false);
edge_color.set_halign(Gtk::Align::START);
edge_color.set_valign(Gtk::Align::CENTER);
edge_color.signal_color_set().connect([this, plot](){plot->set_edge_color(edge_color.get_rgba());});
grid.attach(edge_color_label, 0, row_counter, 1, 1);
grid.attach(edge_color, 1, row_counter++, 1, 1);
//the edge width spinbutton
edge_width_label.set_hexpand(true);
edge_width_label.set_vexpand(false);
edge_width_label.set_valign(Gtk::Align::CENTER);
edge_width_label.set_halign(Gtk::Align::END);
edge_width_spin.set_hexpand(true);
edge_width_spin.set_vexpand(false);
edge_width_spin.set_halign(Gtk::Align::START);
edge_width_spin.set_valign(Gtk::Align::CENTER);
edge_width_spin.set_wrap(true);
edge_width_spin.set_snap_to_ticks(true);
edge_width_spin.set_numeric(true);
edge_width_spin.set_value(plot->get_edge_width());
edge_width_spin.signal_value_changed().connect([this, plot](){
plot->set_edge_width(edge_width_spin.get_value());
});
grid.attach(edge_width_label, 0, row_counter, 1, 1);
grid.attach(edge_width_spin, 1, row_counter++, 1, 1);
//nlevels
nlevels_label.set_hexpand(true);
nlevels_label.set_vexpand(false);
nlevels_label.set_valign(Gtk::Align::CENTER);
nlevels_label.set_halign(Gtk::Align::END);
nlevels_spin.set_hexpand(true);
nlevels_spin.set_vexpand(false);
nlevels_spin.set_halign(Gtk::Align::START);
nlevels_spin.set_valign(Gtk::Align::CENTER);
nlevels_spin.set_wrap(true);
nlevels_spin.set_snap_to_ticks(true);
nlevels_spin.set_numeric(true);
nlevels_spin.set_value(plot->get_nlevels());
nlevels_spin.signal_value_changed().connect([this, plot](){
plot->set_nlevels(nlevels_spin.get_value());
});
grid.attach(nlevels_label, 0, row_counter, 1, 1);
grid.attach(nlevels_spin, 1, row_counter++, 1, 1);
// colormap palette
colormap_palette_label.set_hexpand(true);
colormap_palette_label.set_vexpand(false);
colormap_palette_label.set_valign(Gtk::Align::CENTER);
colormap_palette_label.set_halign(Gtk::Align::END);
colormap_palette_combo.set_hexpand(true);
colormap_palette_combo.set_vexpand(false);
colormap_palette_combo.set_halign(Gtk::Align::START);
colormap_palette_combo.set_valign(Gtk::Align::CENTER);
colormap_palette_combo.append("Default");
colormap_palette_combo.append("Blue → Red");
colormap_palette_combo.append("Blue → Yellow");
colormap_palette_combo.append("Gray");
colormap_palette_combo.append("High frequencies");
colormap_palette_combo.append("Low frequencies");
colormap_palette_combo.append("Radar");
colormap_palette_combo.set_active(plot->get_colormap_palette());
colormap_palette_combo.signal_changed().connect([this, plot](){
plot->set_colormap_palette(static_cast<Gtk::PLplot::ColormapPalette>(colormap_palette_combo.get_active_row_number()));
});
grid.attach(colormap_palette_label, 0, row_counter, 1, 1);
grid.attach(colormap_palette_combo, 1, row_counter++, 1, 1);
//area fill pattern
area_fill_pattern_label.set_hexpand(true);
area_fill_pattern_label.set_vexpand(false);
area_fill_pattern_label.set_valign(Gtk::Align::CENTER);
area_fill_pattern_label.set_halign(Gtk::Align::END);
area_fill_pattern_combo.set_hexpand(true);
area_fill_pattern_combo.set_vexpand(false);
area_fill_pattern_combo.set_halign(Gtk::Align::START);
area_fill_pattern_combo.set_valign(Gtk::Align::CENTER);
area_fill_pattern_combo.append("Solid");
area_fill_pattern_combo.append("Horizontal lines");
area_fill_pattern_combo.append("Vertical lines");
area_fill_pattern_combo.append("Upward lines at 45 degrees");
area_fill_pattern_combo.append("Downward lines at 45 degrees");
area_fill_pattern_combo.append("Upward lines at 30 degrees");
area_fill_pattern_combo.append("Downward lines at 30 degrees");
area_fill_pattern_combo.append("Horizontal and vertical lines");
area_fill_pattern_combo.append("Upward and downward lines at 45 degrees");
area_fill_pattern_combo.set_active(plot->get_area_fill_pattern());
area_fill_pattern_combo.signal_changed().connect([this, plot](){
plot->set_area_fill_pattern(static_cast<Gtk::PLplot::AreaFillPattern>(area_fill_pattern_combo.get_active_row_number()));
if (area_fill_pattern_combo.get_active_row_number() == 0 /* SOLID */) {
area_lines_width_spin.set_sensitive(false);
}
else {
area_lines_width_spin.set_sensitive();
}
});
grid.attach(area_fill_pattern_label, 0, row_counter, 1, 1);
grid.attach(area_fill_pattern_combo, 1, row_counter++, 1, 1);
//the area lines width spinbutton
area_lines_width_label.set_hexpand(true);
area_lines_width_label.set_vexpand(false);
area_lines_width_label.set_valign(Gtk::Align::CENTER);
area_lines_width_label.set_halign(Gtk::Align::END);
area_lines_width_spin.set_hexpand(true);
area_lines_width_spin.set_vexpand(false);
area_lines_width_spin.set_halign(Gtk::Align::START);
area_lines_width_spin.set_valign(Gtk::Align::CENTER);
area_lines_width_spin.set_wrap(true);
area_lines_width_spin.set_snap_to_ticks(true);
area_lines_width_spin.set_numeric(true);
area_lines_width_spin.set_value(plot->get_area_lines_width());
area_lines_width_spin.signal_value_changed().connect([this, plot](){
plot->set_area_lines_width(area_lines_width_spin.get_value());
});
area_lines_width_spin.set_sensitive(false);
grid.attach(area_lines_width_label, 0, row_counter, 1, 1);
grid.attach(area_lines_width_spin, 1, row_counter++, 1, 1);
//colorbar
colorbar_label.set_hexpand(true);
colorbar_label.set_vexpand(false);
colorbar_label.set_valign(Gtk::Align::CENTER);
colorbar_label.set_halign(Gtk::Align::END);
colorbar_switch.set_hexpand(true);
colorbar_switch.set_vexpand(false);
colorbar_switch.set_halign(Gtk::Align::START);
colorbar_switch.set_valign(Gtk::Align::CENTER);
colorbar_switch.set_active(plot->is_showing_colorbar());
colorbar_switch.property_active().signal_changed().connect([this, plot](){
if (colorbar_switch.get_active()) {
plot->show_colorbar();
}
else {
plot->hide_colorbar();
}
});
grid.attach(colorbar_label, 0, row_counter, 1, 1);
grid.attach(colorbar_switch, 1, row_counter++, 1, 1);
paned.set_start_child(grid);
//add canvas to grid
aspect_frame.set_child(canvas);
paned.set_end_child(aspect_frame);
//finishing up
set_child(paned);
paned.set_wide_handle(true);
paned.set_position(height / 2);
}
virtual ~Window() {}
};
}
int main(int argc, char **argv) {
Glib::set_application_name("gtkmm-plplot-test8");
Glib::RefPtr<Gtk::Application> app = Gtk::Application::create("eu.tomschoonjans.gtkmm-plplot-test8");
return app->make_window_and_run<Test8::Window>(argc, argv);
}
a class for contour plots with shaded regions.
Definition plotcontourshades.h:37
Example 8
Example 9: a Three-dimensional plot
/*
Copyright (C) 2015 Tom Schoonjans
This program is free software: you can redistribute it and/or modify
it under the terms of the GNU Lesser General Public License as published by
the Free Software Foundation, either version 3 of the License, or
(at your option) any later version.
This program is distributed in the hope that it will be useful,
but WITHOUT ANY WARRANTY; without even the implied warranty of
MERCHANTABILITY or FITNESS FOR A PARTICULAR PURPOSE. See the
GNU Lesser General Public License for more details.
You should have received a copy of the GNU Lesser General Public License
along with this program. If not, see <http://www.gnu.org/licenses/>.
*/
#include "gtkmm-plplot.h"
#include <gtkmm/application.h>
#include <gtkmm/aspectframe.h>
#include <glibmm/miscutils.h>
#include <glib.h>
#include <gtkmm/window.h>
#include <gtkmm/switch.h>
#include <gtkmm/label.h>
#include <gtkmm/comboboxtext.h>
#include <gtkmm/grid.h>
#include <gtkmm/spinbutton.h>
#include <gtkmm/colorbutton.h>
#ifndef M_PI
#define M_PI (3.14159265358979323846)
#endif
namespace Test9 {
class Window : public Gtk::Window {
private:
Gtk::PLplot::Canvas canvas;
Gtk::Grid grid;
Gtk::Label label1;
Gtk::Label label2;
Gtk::ColorButton color_combo1;
Gtk::ColorButton color_combo2;
Gtk::ComboBoxText linestyle_combo1;
Gtk::ComboBoxText linestyle_combo2;
Gtk::Switch show_radio1;
Gtk::Switch show_radio2;
Glib::RefPtr<Gtk::Adjustment> linewidth_adj1;
Glib::RefPtr<Gtk::Adjustment> linewidth_adj2;
Gtk::SpinButton linewidth_spin1;
Gtk::SpinButton linewidth_spin2;
Glib::RefPtr<Gtk::Adjustment> altitude_adj;
Glib::RefPtr<Gtk::Adjustment> azimuth_adj;
Gtk::SpinButton altitude_spin;
Gtk::SpinButton azimuth_spin;
Gtk::Label altitude_label;
Gtk::Label azimuth_label;
public:
Window() :
label1("Plot 1"), label2("Plot 2"),
linewidth_adj1(Gtk::Adjustment::create(1.0, 0.1, 10.0, 0.1, 1.0, 0.0)),
linewidth_adj2(Gtk::Adjustment::create(1.0, 0.1, 10.0, 0.1, 1.0, 0.0)),
linewidth_spin1(linewidth_adj1, 0.1, 1.0),
linewidth_spin2(linewidth_adj2, 0.1, 1.0),
altitude_adj(Gtk::Adjustment::create(45.0, 0, 90.0, 1.0, 5.0, 0.0)),
azimuth_adj(Gtk::Adjustment::create(45.0, 0, 360.0, 1.0, 5.0, 0.0)),
altitude_spin(altitude_adj, 0.1, 1.0),
azimuth_spin(azimuth_adj, 0.1, 1.0),
altitude_label("Altitude"),
azimuth_label("Azimuth") {
//generate our data
//first a helix
std::valarray<double> x_va1 = cos(Gtk::PLplot::indgen_va(1000)*8.0*M_PI/999.0);
std::valarray<double> y_va1 = sin(Gtk::PLplot::indgen_va(1000)*8.0*M_PI/999.0);
std::valarray<double> z_va1 = Gtk::PLplot::indgen_va(1000)*10.0/999.0 - 5.0;
data1->set_name("Helix");
//followed by a simple sine
std::valarray<double> x_va2 = Gtk::PLplot::indgen_va(1000)*6.0/999.0 - 3.0;
std::valarray<double> y_va2 = Gtk::PLplot::indgen_va(1000)*6.0/999.0 - 3.0;
std::valarray<double> z_va2 = cos(sqrt(x_va2*x_va2 + y_va2*y_va2));
Gtk::PLplot::PlotData3D *data2 = Gtk::manage(new Gtk::PLplot::PlotData3D(x_va2, y_va2, z_va2, Gdk::RGBA("blue"), Gtk::PLplot::LineStyle::LONG_DASH_LONG_GAP));
data2->set_name("Cosine");
plot->add_data(*data2);
plot->set_plot_title("Plot3D demo");
canvas.add_plot(*plot);
const int width = 1024, height = 720;
set_default_size(width, height);
set_title("Gtkmm-PLplot test9");
canvas.set_hexpand(true);
canvas.set_vexpand(true);
canvas.set_focusable(true);
Gtk::AspectFrame geometry(Gtk::Align::CENTER, Gtk::Align::CENTER, float(width)/float(height), false);
geometry.set_child(canvas);
show_radio1.set_active(data1->is_showing());
show_radio2.set_active(data2->is_showing());
show_radio1.property_active().signal_changed().connect([this, data1](){
if (show_radio1.get_active()) {
data1->show();
color_combo1.set_sensitive(true);
}
else {
data1->hide();
color_combo1.set_sensitive(false);
}
});
show_radio2.property_active().signal_changed().connect([this, data2](){
if (show_radio2.get_active()) {
data2->show();
color_combo2.set_sensitive(true);
}
else {
data2->hide();
color_combo2.set_sensitive(false);
}
});
linestyle_combo1.append("continuous");
linestyle_combo1.append("short dash short gap");
linestyle_combo1.append("long dash long gap");
linestyle_combo1.append("long dash short gap");
linestyle_combo1.append("long dash short gap short dash short gap");
linestyle_combo1.append("long dash short gap long dash short gap");
linestyle_combo2.append("continuous");
linestyle_combo2.append("short dash short gap");
linestyle_combo2.append("long dash long gap");
linestyle_combo2.append("long dash short gap");
linestyle_combo2.append("long dash short gap short dash short gap");
linestyle_combo2.append("long dash short gap long dash short gap");
linewidth_spin1.set_wrap(true);
linewidth_spin2.set_wrap(true);
linewidth_spin1.set_snap_to_ticks(true);
linewidth_spin2.set_snap_to_ticks(true);
linewidth_spin1.set_numeric(true);
linewidth_spin2.set_numeric(true);
color_combo1.set_hexpand(false);
color_combo2.set_hexpand(false);
linewidth_spin1.set_halign(Gtk::Align::START);
linewidth_spin2.set_halign(Gtk::Align::START);
show_radio1.set_hexpand(false);
show_radio2.set_hexpand(false);
label1.set_hexpand(true);
label2.set_hexpand(true);
linewidth_spin1.set_hexpand(true);
linewidth_spin2.set_hexpand(true);
linestyle_combo1.set_hexpand(false);
linestyle_combo2.set_hexpand(false);
label1.set_halign(Gtk::Align::END);
label2.set_halign(Gtk::Align::END);
grid.set_column_homogeneous(false);
grid.set_column_spacing(5);
grid.set_row_spacing(5);
color_combo1.set_rgba(data1->get_color());
color_combo2.set_rgba(data2->get_color());
color_combo1.set_use_alpha(true);
color_combo2.set_use_alpha(true);
linestyle_combo1.set_active(data1->get_line_style()-1);
linestyle_combo2.set_active(data2->get_line_style()-1);
color_combo1.signal_color_set().connect([this, data1](){data1->set_color(color_combo1.get_rgba());});
color_combo2.signal_color_set().connect([this, data2](){data2->set_color(color_combo2.get_rgba());});
linestyle_combo1.signal_changed().connect([this, data1](){data1->set_line_style(static_cast<Gtk::PLplot::LineStyle>(linestyle_combo1.get_active_row_number()+1));});
linestyle_combo2.signal_changed().connect([this, data2](){data2->set_line_style(static_cast<Gtk::PLplot::LineStyle>(linestyle_combo2.get_active_row_number()+1));});
linewidth_spin1.set_value(data1->get_line_width());
linewidth_spin2.set_value(data2->get_line_width());
linewidth_spin1.signal_value_changed().connect([this, data1](){data1->set_line_width(linewidth_spin1.get_value());});
linewidth_spin2.signal_value_changed().connect([this, data2](){data2->set_line_width(linewidth_spin2.get_value());});
altitude_spin.set_wrap(true);
azimuth_spin.set_wrap(true);
altitude_spin.set_snap_to_ticks(true);
azimuth_spin.set_snap_to_ticks(true);
altitude_spin.set_numeric(true);
azimuth_spin.set_numeric(true);
altitude_label.set_halign(Gtk::Align::END);
azimuth_label.set_halign(Gtk::Align::END);
altitude_spin.set_halign(Gtk::Align::START);
azimuth_spin.set_halign(Gtk::Align::START);
altitude_label.set_hexpand(false);
azimuth_label.set_hexpand(false);
altitude_label.set_vexpand(false);
azimuth_label.set_vexpand(false);
altitude_spin.set_hexpand(false);
azimuth_spin.set_hexpand(false);
altitude_spin.set_vexpand(false);
azimuth_spin.set_vexpand(false);
altitude_spin.set_value(plot->get_altitude());
azimuth_spin.set_value(plot->get_azimuth());
altitude_spin.signal_value_changed().connect(
[this, plot]() {
plot->set_altitude(altitude_spin.get_value());
}
);
azimuth_spin.signal_value_changed().connect(
[this, plot]() {
plot->set_azimuth(azimuth_spin.get_value());
}
);
grid.attach(label1, 0, 0, 1, 1);
grid.attach(show_radio1, 1, 0, 1, 1);
grid.attach(color_combo1, 2, 0, 1, 1);
grid.attach(linestyle_combo1, 3, 0, 1, 1);
grid.attach(linewidth_spin1, 4, 0, 1, 1);
grid.attach(label2, 0, 1, 1, 1);
grid.attach(show_radio2, 1, 1, 1, 1);
grid.attach(color_combo2, 2, 1, 1, 1);
grid.attach(linestyle_combo2, 3, 1, 1, 1);
grid.attach(linewidth_spin2, 4, 1, 1, 1);
grid.attach(geometry, 0, 2, 5, 1);
grid.attach(altitude_label, 0, 3, 3, 1);
grid.attach(altitude_spin, 3, 3, 2, 1);
grid.attach(azimuth_label, 0, 4, 3, 1);
grid.attach(azimuth_spin, 3, 4, 2, 1);
grid.set_margin(10);
set_child(grid);
}
virtual ~Window() {}
};
}
int main(int argc, char **argv) {
Glib::set_application_name("gtkmm-plplot-test9");
Glib::RefPtr<Gtk::Application> app = Gtk::Application::create("eu.tomschoonjans.gtkmm-plplot-test9");
return app->make_window_and_run<Test9::Window>(argc, argv);
}
double get_altitude()
double get_azimuth()
void set_azimuth(double azimuth)
virtual void add_data(PlotData3D &data)
void set_altitude(double altitude)
a class that will hold a single dataset and its properties for a Plot3D plot
Definition plotdata3d.h:38
void set_plot_title(Glib::ustring title)
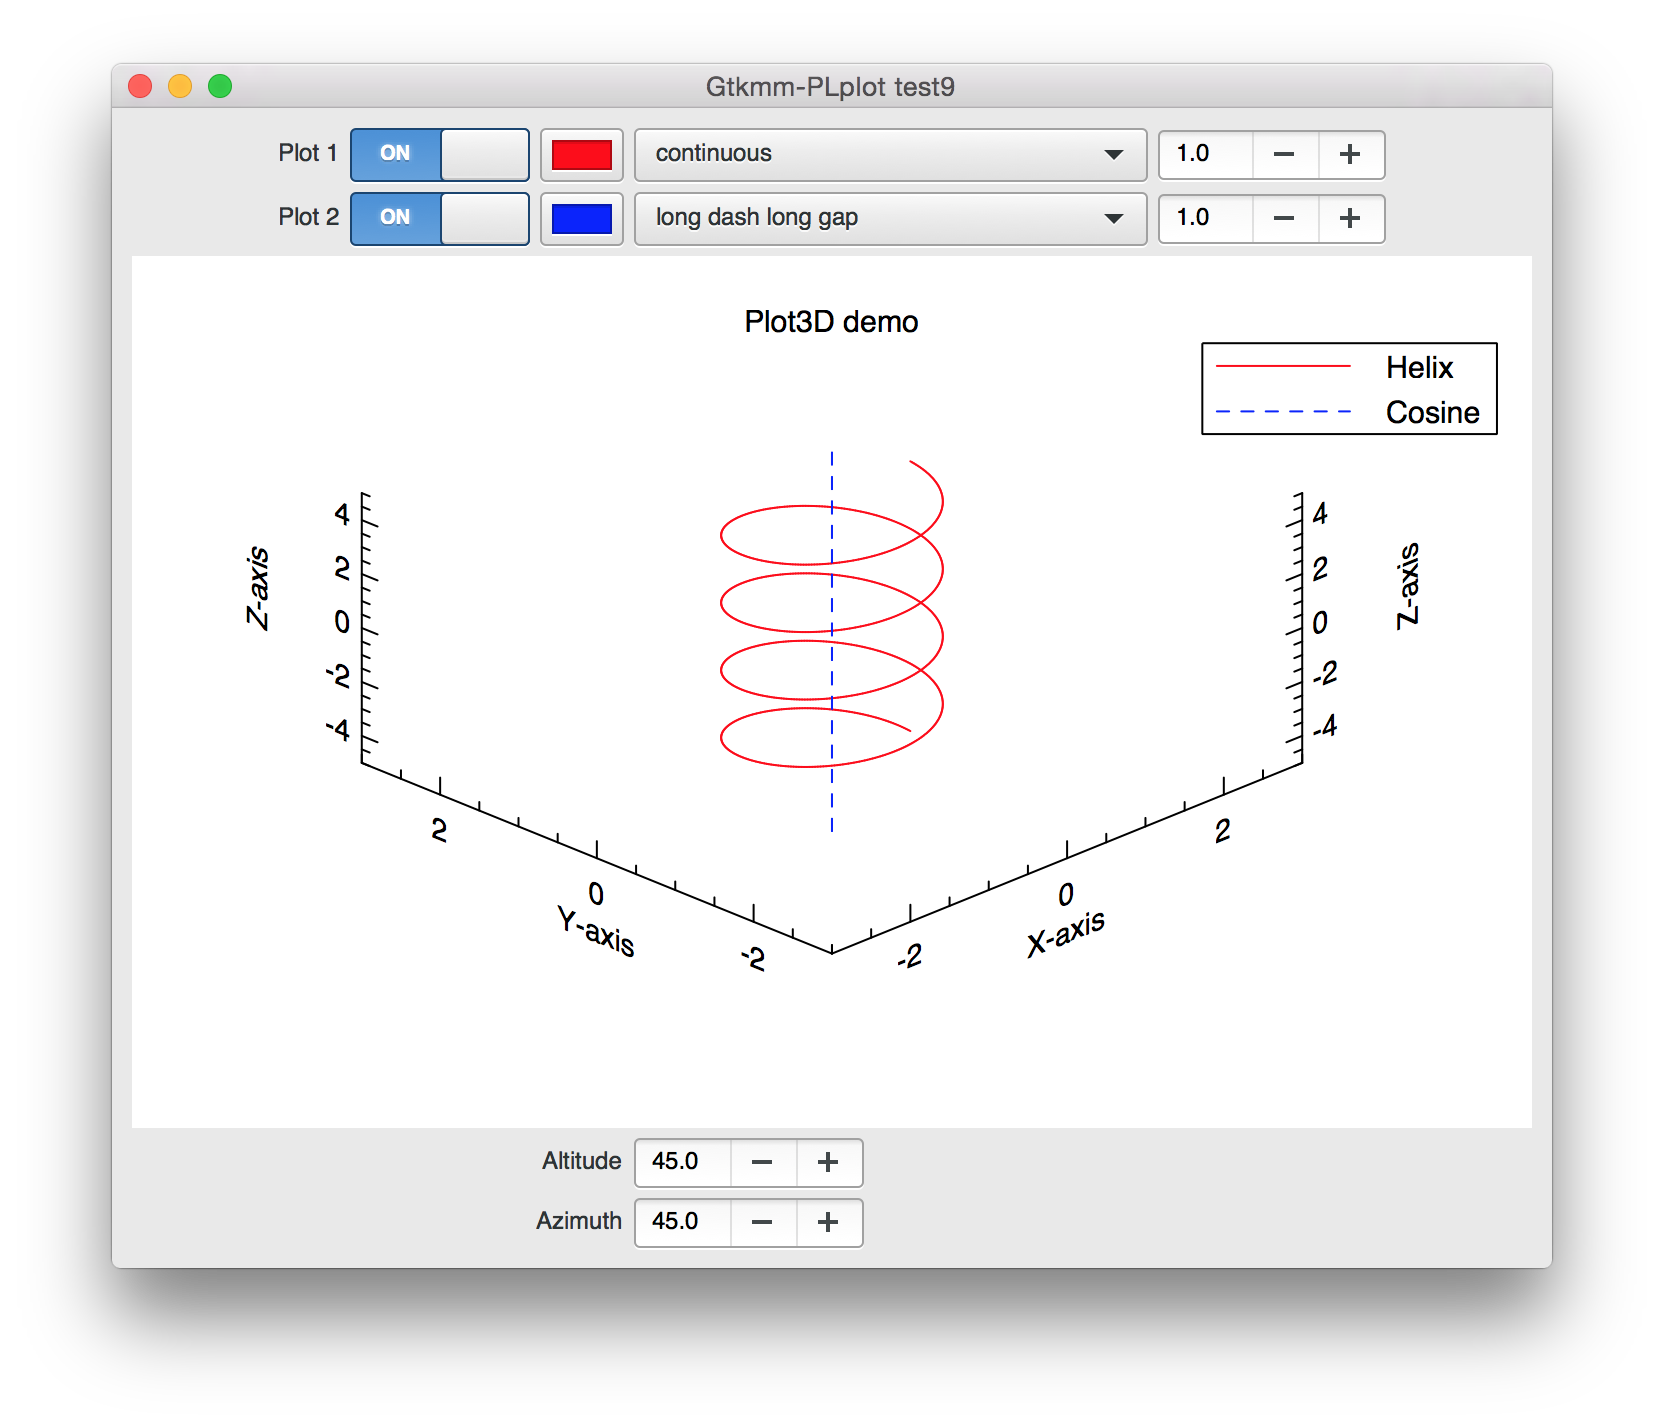
Example 9
Example 10: use Gtkmm-PLplot from Gtk+
/*
Copyright (C) 2016 Tom Schoonjans
This program is free software: you can redistribute it and/or modify
it under the terms of the GNU Lesser General Public License as published by
the Free Software Foundation, either version 3 of the License, or
(at your option) any later version.
This program is distributed in the hope that it will be useful,
but WITHOUT ANY WARRANTY; without even the implied warranty of
MERCHANTABILITY or FITNESS FOR A PARTICULAR PURPOSE. See the
GNU Lesser General Public License for more details.
You should have received a copy of the GNU Lesser General Public License
along with this program. If not, see <http://www.gnu.org/licenses/>.
*/
/* This examples demonstrates how to use Gtkmm-PLplot from Gtk */
#include "gtkmm-plplot.h"
#include <gtkmm/init.h>
#ifndef M_PI
#define M_PI (3.14159265358979323846)
#endif
static void activate (GtkApplication* app, gpointer user_data) {
Glib::ustring x_title = "X-axis";
Glib::ustring y_title = "Y-axis";
Glib::ustring plot_title = "";
Gdk::RGBA color = Gdk::RGBA("red");
std::valarray<double> x_va(1000), y_va(1000);
for (unsigned int i = 0 ; i < 1000 ; i++) {
x_va[i] = 8*M_PI*i/999;
}
y_va = 2*cos(x_va)-1;
// Gtk::manage even seems to work when the canvas is added to a GTK+ container,
// instead of Gtkmm::Container!!!
// This means we will not have to manually free canvas ourselves, which is
// really cool!
*Gtk::manage(
new Gtk::PLplot::Plot2D(
*Gtk::manage(
x_va,
y_va,
color
)
),
x_title,
y_title,
plot_title
)
)
));
GtkWidget *window = gtk_application_window_new(app);
gtk_window_set_title (GTK_WINDOW (window), "Gtkmm-PLplot test10");
gtk_window_set_default_size (GTK_WINDOW (window), 720, 580);
// print the type name
std::cout << "Type:" << g_type_name(G_OBJECT_TYPE(canvas->gobj())) << std::endl;
// this next line is where the magic happens
gtk_window_set_child (GTK_WINDOW (window), GTK_WIDGET(canvas->gobj()));
gtk_widget_show(window);
}
int main (int argc, char **argv) {
GtkApplication *app;
int status;
app = gtk_application_new ("org.gtk.example", G_APPLICATION_FLAGS_NONE);
// this next line is necessary to ensure that the gtkmm internals are initialized
Gtk::init_gtkmm_internals();
g_signal_connect (app, "activate", G_CALLBACK (activate), NULL);
status = g_application_run (G_APPLICATION (app), argc, argv);
g_object_unref (app);
return status;
}
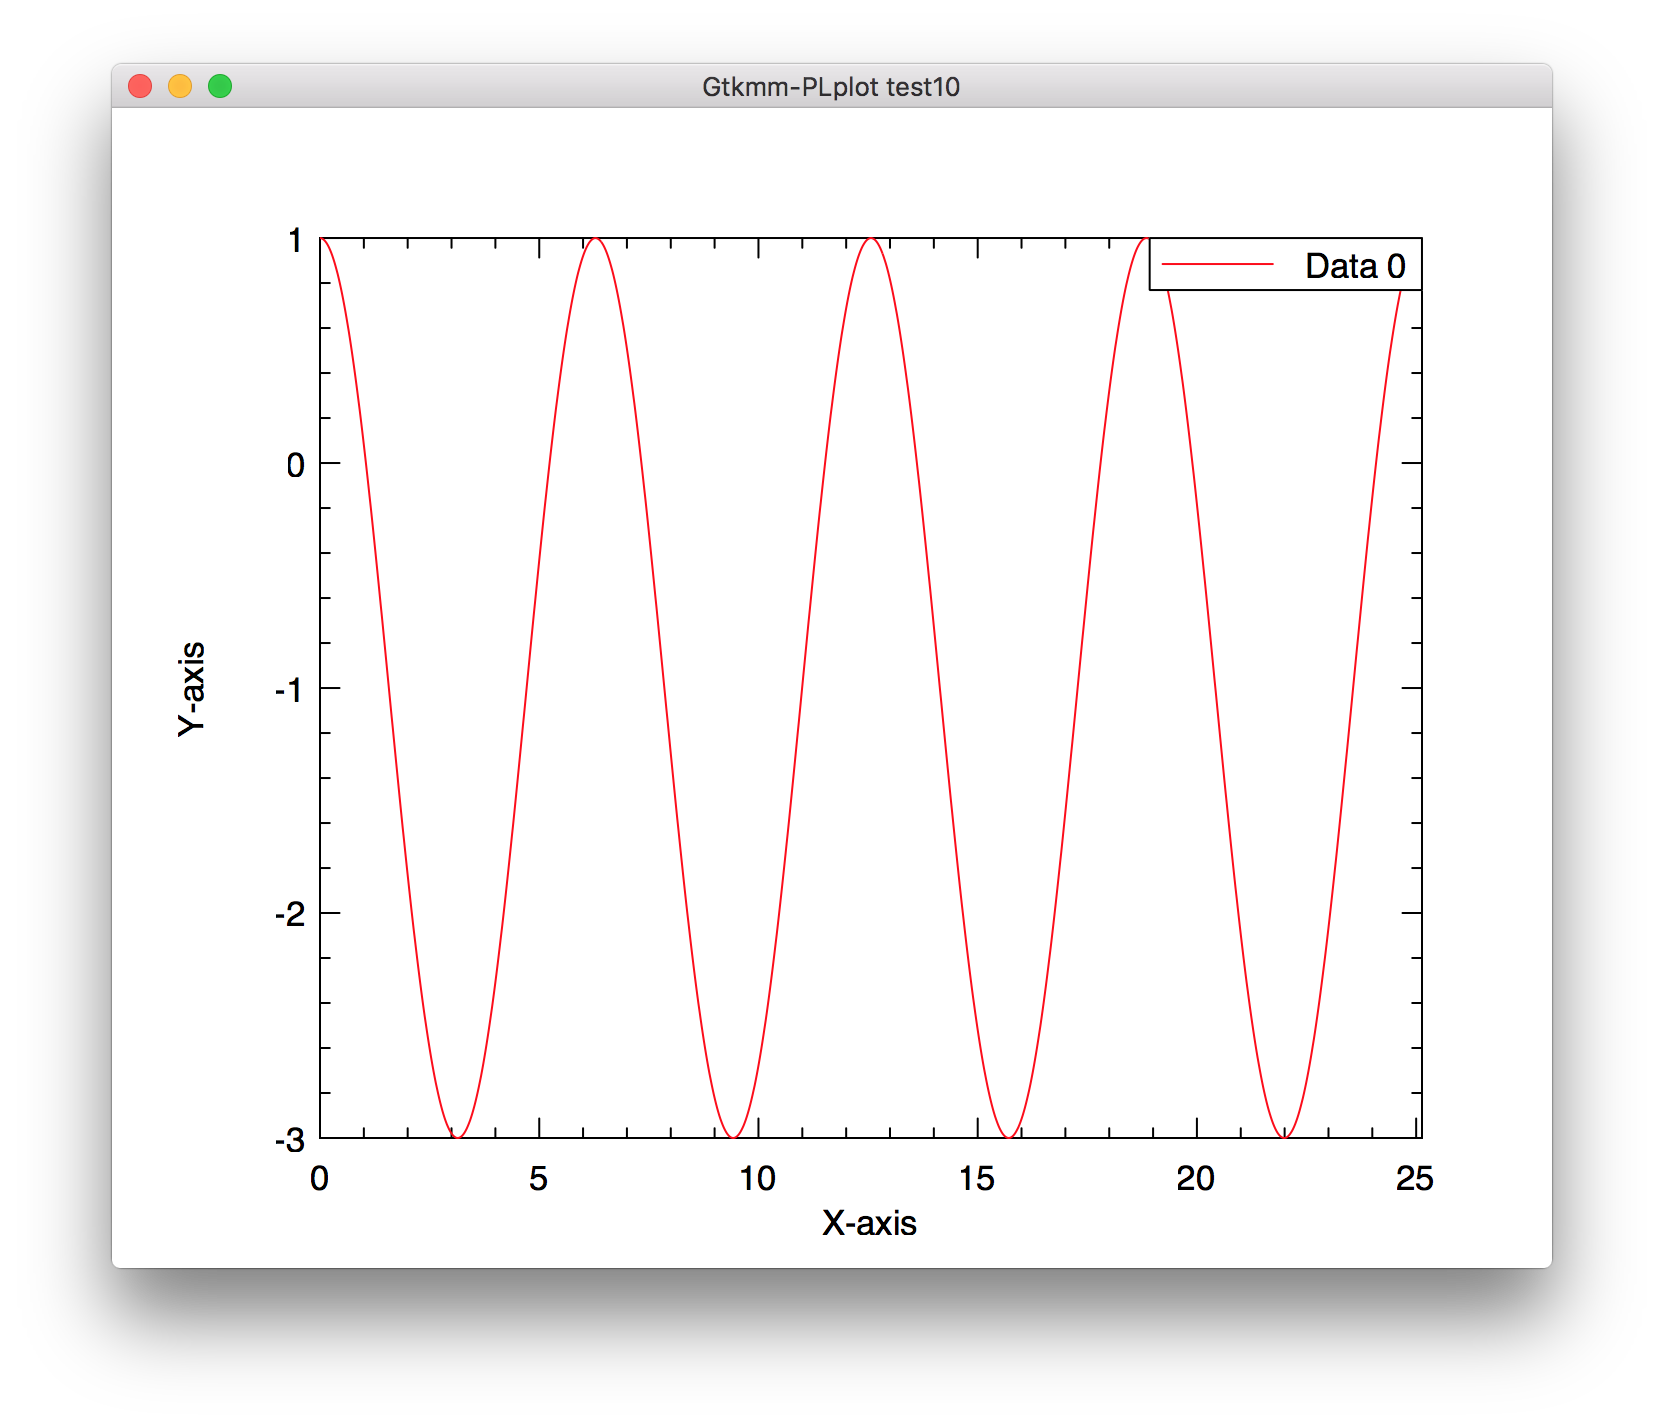
Example 10
Example 11: 2 dimensional plots with errorbars
/*
Copyright (C) 2016 Tom Schoonjans
This program is free software: you can redistribute it and/or modify
it under the terms of the GNU Lesser General Public License as published by
the Free Software Foundation, either version 3 of the License, or
(at your option) any later version.
This program is distributed in the hope that it will be useful,
but WITHOUT ANY WARRANTY; without even the implied warranty of
MERCHANTABILITY or FITNESS FOR A PARTICULAR PURPOSE. See the
GNU Lesser General Public License for more details.
You should have received a copy of the GNU Lesser General Public License
along with this program. If not, see <http://www.gnu.org/licenses/>.
*/
#include "gtkmm-plplot.h"
#include <gtkmm/application.h>
#include <gtkmm/aspectframe.h>
#include <glibmm/miscutils.h>
#include <gtkmm/window.h>
#include <valarray>
#ifndef M_PI
#define M_PI (3.14159265358979323846)
#endif
namespace Test11 {
class Window : public Gtk::Window {
private:
std::valarray<double> x;
std::valarray<double> xmin;
std::valarray<double> xmax;
std::valarray<double> y;
std::valarray<double> ymin;
std::valarray<double> ymax;
Gtk::PLplot::Canvas canvas;
Gtk::PLplot::PlotData2D plot_data_2d;
Gtk::PLplot::PlotData2DErrorX plot_data_2d_error_x;
Gtk::PLplot::PlotData2DErrorY plot_data_2d_error_y;
Gtk::PLplot::PlotData2DErrorXY plot_data_2d_error_xy;
Gtk::PLplot::Plot2D plot_2d;
Gtk::PLplot::Plot2D plot_2d_error_x;
Gtk::PLplot::Plot2D plot_2d_error_y;
Gtk::PLplot::Plot2D plot_2d_error_xy;
public:
Window() :
x(Gtk::PLplot::indgen_va(40) * 2.0 * M_PI / 39.0),
xmin(x - 2.0 * M_PI / 80.0),
xmax(x + 2.0 * M_PI / 80.0),
y(sin(x)),
ymin(y - 0.1 - Gtk::PLplot::indgen_va(40) / 39.0),
ymax(y + 0.1 + Gtk::PLplot::indgen_va(40) / 39.0),
canvas(),
plot_data_2d(x, y),
plot_data_2d_error_x(x, y, xmin, xmax),
plot_data_2d_error_y(x, y, ymin, ymax),
plot_data_2d_error_xy(x, y, xmin, xmax, ymin, ymax),
plot_2d(plot_data_2d, "X-axis", "Y-axis", "No errorbars", 0.5, 0.5, 0.0, 0.0),
plot_2d_error_x(plot_data_2d_error_x, "X-axis", "Y-axis", "X-data errorbars", 0.5, 0.5, 0.5, 0.0),
plot_2d_error_y(plot_data_2d_error_y, "X-axis", "Y-axis", "Y-data errorbars", 0.5, 0.5, 0.0, 0.5),
plot_2d_error_xy(plot_data_2d_error_xy, "X-axis", "Y-axis", "X- and Y-data errorbars", 0.5, 0.5, 0.5, 0.5)
{
// no need to show legends
plot_2d.hide_legend();
plot_2d_error_x.hide_legend();
plot_2d_error_y.hide_legend();
plot_2d_error_xy.hide_legend();
// a some color
plot_data_2d_error_x.set_error_x_color(Gdk::RGBA("blue"));
plot_data_2d_error_xy.set_error_x_color(Gdk::RGBA("blue"));
plot_data_2d_error_y.set_error_y_color(Gdk::RGBA("green"));
plot_data_2d_error_xy.set_error_y_color(Gdk::RGBA("green"));
// add all plots to the canvas
canvas.add_plot(plot_2d);
canvas.add_plot(plot_2d_error_x);
canvas.add_plot(plot_2d_error_y);
canvas.add_plot(plot_2d_error_xy);
const int width = 1024, height = 825;
set_default_size(width, height);
set_title("Gtkmm-PLplot test11");
canvas.set_hexpand(true);
canvas.set_vexpand(true);
canvas.set_focusable(true);
Gtk::AspectFrame geometry(Gtk::Align::CENTER, Gtk::Align::CENTER, float(width)/float(height), false);
geometry.set_child(canvas);
geometry.set_margin(10);
set_child(geometry);
}
virtual ~Window() {}
};
}
int main(int argc, char **argv) {
Glib::set_application_name("gtkmm-plplot-test11");
Glib::RefPtr<Gtk::Application> app = Gtk::Application::create("eu.tomschoonjans.gtkmm-plplot-test11");
return app->make_window_and_run<Test11::Window>(argc, argv);
}
a class that will hold a single XY dataset with X errorbars and its properties for a Plot2D plot
Definition plotdata2derrorx.h:38
void set_error_x_color(Gdk::RGBA color)
a class that will hold a single XY dataset with X and Y errorbars and its properties for a Plot2D plo...
Definition plotdata2derrorxy.h:39
a class that will hold a single XY dataset with Y errorbars and its properties for a Plot2D plot
Definition plotdata2derrory.h:38
void set_error_y_color(Gdk::RGBA color)
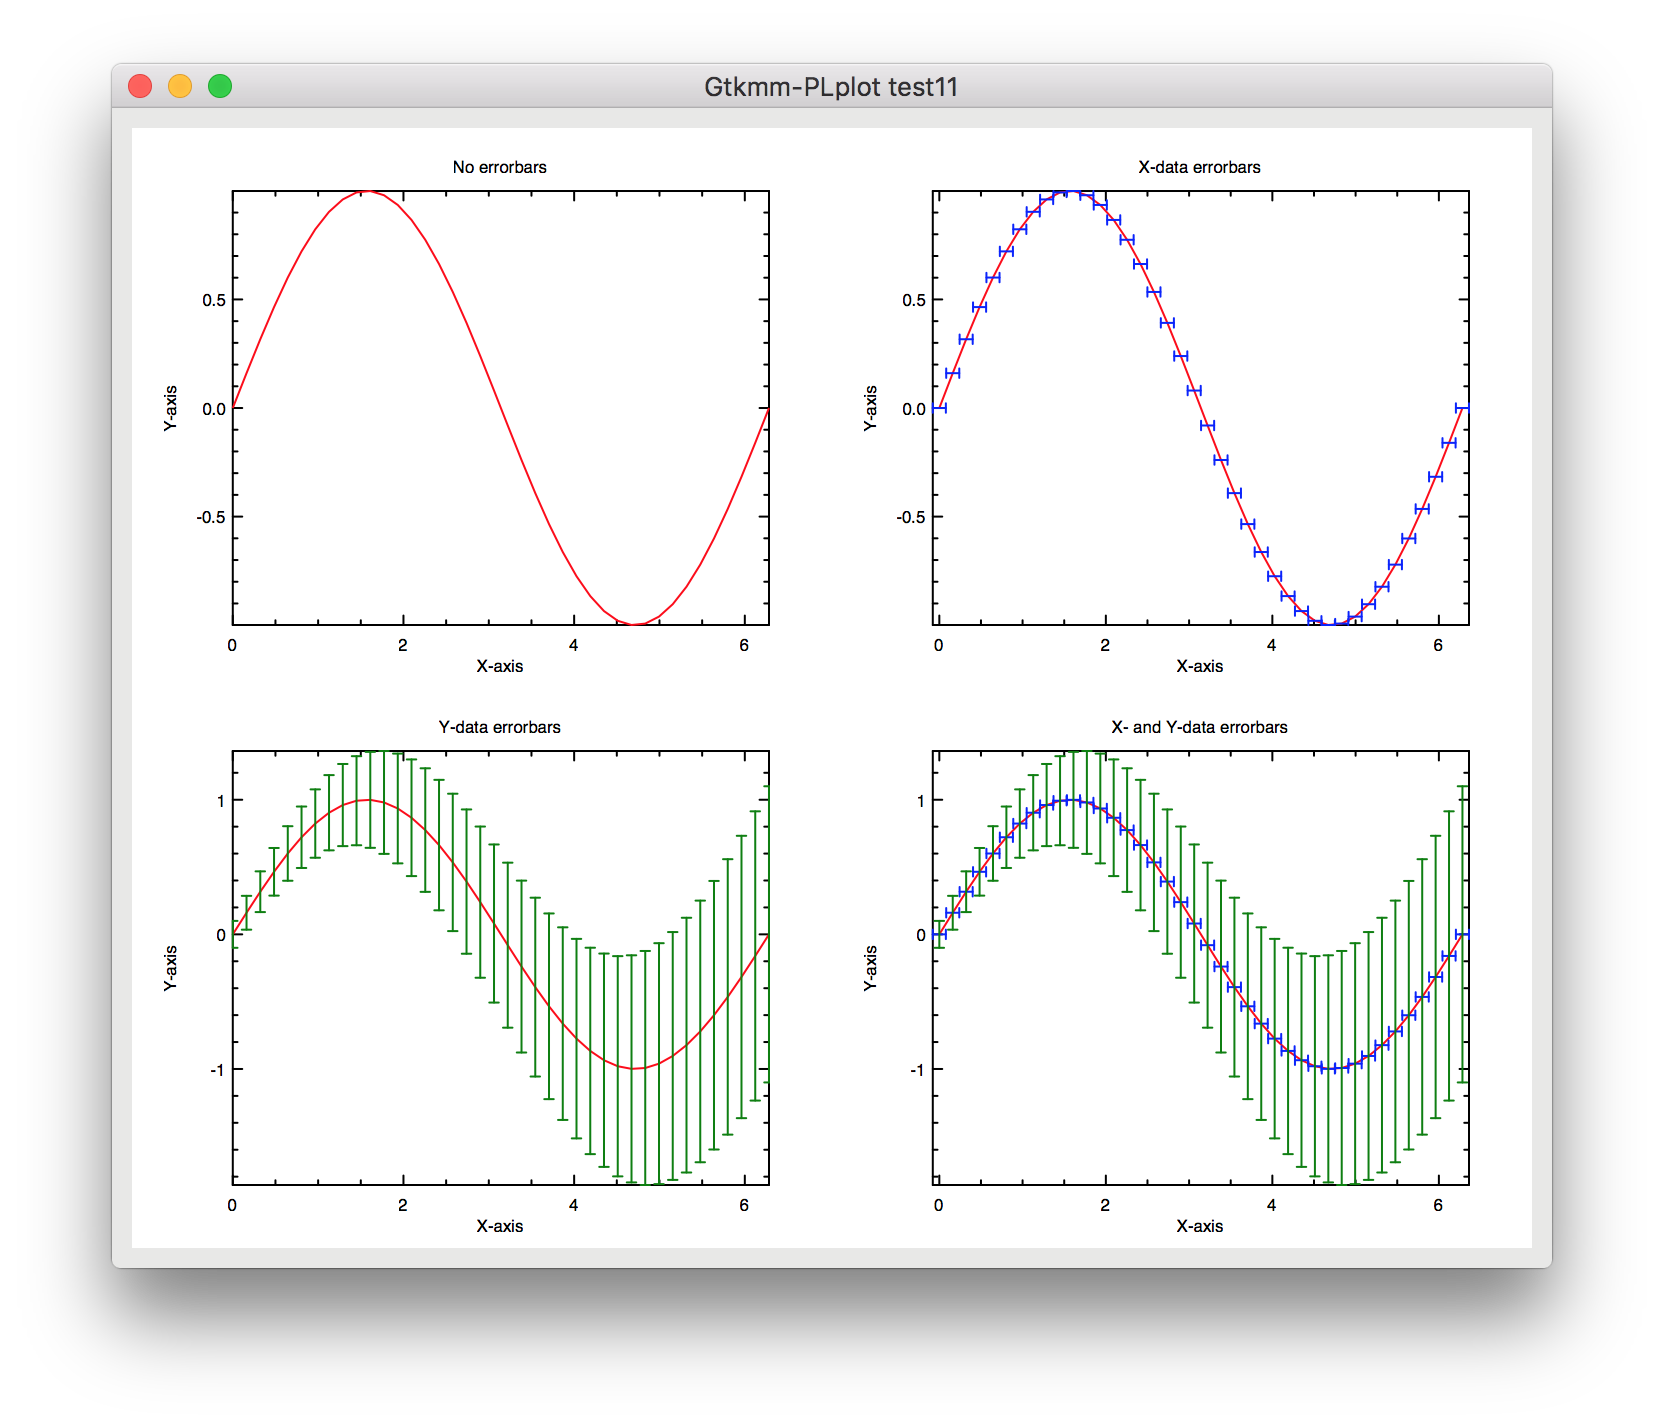
Example 11
Example 12: Histograms
/*
Copyright (C) 2017 Tom Schoonjans
This program is free software: you can redistribute it and/or modify
it under the terms of the GNU Lesser General Public License as published by
the Free Software Foundation, either version 3 of the License, or
(at your option) any later version.
This program is distributed in the hope that it will be useful,
but WITHOUT ANY WARRANTY; without even the implied warranty of
MERCHANTABILITY or FITNESS FOR A PARTICULAR PURPOSE. See the
GNU Lesser General Public License for more details.
You should have received a copy of the GNU Lesser General Public License
along with this program. If not, see <http://www.gnu.org/licenses/>.
*/
#include <gtkmm-plplot.h>
#include <gtkmm/application.h>
#include <gtkmm/aspectframe.h>
#include <glibmm/miscutils.h>
#include <glib.h>
#include <gtkmm/window.h>
#include <gtkmm/switch.h>
#include <gtkmm/grid.h>
#include <gtkmm/spinbutton.h>
#include <gtkmm/colorbutton.h>
#include <gtkmm/label.h>
#include <gtkmm/comboboxtext.h>
#include <gtkmm/notebook.h>
#include <functional>
#include <random>
#ifndef M_PI
#define M_PI (3.14159265358979323846)
#endif
namespace Test12 {
class HistogramTab : public Gtk::Grid {
private:
Gtk::Label line_label;
Gtk::ComboBoxText linestyle_combo;
Gtk::ColorButton line_color;
Glib::RefPtr<Gtk::Adjustment> linewidth_adj;
Gtk::SpinButton linewidth_spin;
Gtk::Switch expand_bins;
Gtk::Switch empty_bins;
HistogramTab() = delete;
protected:
Gtk::PLplot::Canvas canvas;
Gtk::PLplot::PlotDataHistogram *histogram_data;
public:
HistogramTab(Gtk::PLplot::PlotDataHistogram *_histogram_data, Glib::ustring x_title, Glib::ustring y_title, Glib::ustring plot_title) :
line_label("Histogram"),
linewidth_adj(Gtk::Adjustment::create(1.0, 0.1, 10.0, 0.1, 1.0, 0.0)),
linewidth_spin(linewidth_adj, 0.1, 1.0),
canvas(*Gtk::manage(new Gtk::PLplot::PlotHistogram(*_histogram_data, x_title, y_title, plot_title))),
histogram_data(_histogram_data)
{
set_column_homogeneous(false);
set_column_spacing(5);
set_row_homogeneous(false);
set_row_spacing(5);
set_margin(10);
line_label.set_hexpand(true);
line_label.set_vexpand(false);
line_label.set_valign(Gtk::Align::CENTER);
line_label.set_halign(Gtk::Align::END);
attach(line_label, 0, 0, 1, 1);
//the color buttons
line_color.set_rgba(plot_data->get_color());
line_color.set_use_alpha(true);
line_color.set_hexpand(false);
line_color.set_vexpand(false);
line_color.set_halign(Gtk::Align::FILL);
line_color.set_valign(Gtk::Align::CENTER);
line_color.signal_color_set().connect([this, plot_data](){plot_data->set_color(line_color.get_rgba());});
attach(line_color, 1, 0, 1, 1);
//the linestyle comboboxtext
linestyle_combo.append("none");
linestyle_combo.append("continuous");
linestyle_combo.append("short dash short gap");
linestyle_combo.append("long dash long gap");
linestyle_combo.append("long dash short gap");
linestyle_combo.append("long dash short gap short dash short gap");
linestyle_combo.append("long dash short gap long dash short gap");
linestyle_combo.set_active(plot_data->get_line_style());
linestyle_combo.signal_changed().connect([this, plot_data](){plot_data->set_line_style(static_cast<Gtk::PLplot::LineStyle>(linestyle_combo.get_active_row_number()));});
linestyle_combo.set_hexpand(false);
linestyle_combo.set_vexpand(false);
linestyle_combo.set_halign(Gtk::Align::CENTER);
linestyle_combo.set_valign(Gtk::Align::CENTER);
attach(linestyle_combo, 2, 0, 1, 1);
//our spinbuttons, first one for the line thickness, second for symbol size
linewidth_spin.set_hexpand(true);
linewidth_spin.set_vexpand(false);
linewidth_spin.set_halign(Gtk::Align::START);
linewidth_spin.set_valign(Gtk::Align::CENTER);
linewidth_spin.set_wrap(true);
linewidth_spin.set_snap_to_ticks(true);
linewidth_spin.set_numeric(true);
linewidth_spin.set_value(plot_data->get_line_width());
linewidth_spin.signal_value_changed().connect([this, plot_data](){plot_data->set_line_width(linewidth_spin.get_value());});
attach(linewidth_spin, 3, 0, 1, 1);
canvas.set_hexpand(true);
canvas.set_vexpand(true);
canvas.set_focusable(true);
canvas.set_background_color(Gdk::RGBA("LightGrey"));
Gtk::AspectFrame geometry(Gtk::Align::CENTER, Gtk::Align::CENTER, 2, false);
geometry.set_child(canvas);
attach(geometry, 0, 1, 4, 1);
Gtk::Label *label;
label = Gtk::manage(new Gtk::Label("Expand bins"));
label->set_halign(Gtk::Align::END);
label->set_hexpand(false);
attach(*label, 0, 2, 1, 1);
expand_bins.set_hexpand(false);
expand_bins.set_halign(Gtk::Align::START);
attach(expand_bins, 1, 2, 1, 1);
label = Gtk::manage(new Gtk::Label("Show empty bins"));
label->set_halign(Gtk::Align::END);
label->set_hexpand(false);
attach(*label, 2, 2, 1, 1);
empty_bins.set_hexpand(false);
empty_bins.set_halign(Gtk::Align::START);
attach(empty_bins, 3, 2, 1, 1);
expand_bins.set_active(histogram_data->get_expand_bins());
expand_bins.property_active().signal_changed().connect([this](){
histogram_data->set_expand_bins(expand_bins.get_active());
});
empty_bins.set_active(histogram_data->get_empty_bins());
empty_bins.property_active().signal_changed().connect([this](){
histogram_data->set_empty_bins(empty_bins.get_active());
});
}
};
class HistogramBinnedTab : public HistogramTab {
private:
Gtk::Switch centred;
HistogramBinnedTab() = delete;
public:
HistogramBinnedTab(Gtk::PLplot::PlotDataHistogramBinned *_histogram_data, Glib::ustring x_title, Glib::ustring y_title, Glib::ustring plot_title) :
HistogramTab(_histogram_data, x_title, y_title, plot_title) {
Gtk::Label *label;
label = Gtk::manage(new Gtk::Label("X-data is centred"));
label->set_halign(Gtk::Align::END);
label->set_hexpand(false);
label->set_vexpand(false);
attach(*label, 0, 3, 1, 1);
centred.set_halign(Gtk::Align::START);
centred.set_hexpand(false);
centred.set_vexpand(false);
centred.set_active(_histogram_data->get_centred());
centred.property_active().signal_changed().connect([this, _histogram_data](){
_histogram_data->set_centred(centred.get_active());
});
attach(centred, 1, 3, 1, 1);
}
};
class HistogramUnbinnedTab : public HistogramTab {
private:
/* Gtk::Button add_data_button; */
Gtk::Switch ignore_outliers;
Glib::RefPtr<Gtk::Adjustment> datmin_adj;
Glib::RefPtr<Gtk::Adjustment> datmax_adj;
Glib::RefPtr<Gtk::Adjustment> nbins_adj;
Gtk::SpinButton datmin_spin;
Gtk::SpinButton datmax_spin;
Gtk::SpinButton nbins_spin;
HistogramUnbinnedTab() = delete;
public:
HistogramUnbinnedTab(Gtk::PLplot::PlotDataHistogramUnbinned *_histogram_data, Glib::ustring x_title, Glib::ustring y_title, Glib::ustring plot_title) :
HistogramTab(_histogram_data, x_title, y_title, plot_title),
datmin_adj(Gtk::Adjustment::create(_histogram_data->get_data_minimum(), _histogram_data->get_data_minimum(), _histogram_data->get_data_maximum() - 0.01, 0.1)),
datmax_adj(Gtk::Adjustment::create(_histogram_data->get_data_maximum(), _histogram_data->get_data_minimum() + 0.01, _histogram_data->get_data_maximum(), 0.1)),
nbins_adj(Gtk::Adjustment::create(_histogram_data->get_nbins(), 3, 100, 1)),
datmin_spin(datmin_adj, 0.1, 1),
datmax_spin(datmax_adj, 0.1, 1),
nbins_spin(nbins_adj, 1, 0)
{
Gtk::Label *label;
label = Gtk::manage(new Gtk::Label("Ignore outliers"));
label->set_halign(Gtk::Align::END);
label->set_hexpand(false);
label->set_vexpand(false);
attach(*label, 0, 3, 1, 1);
ignore_outliers.set_halign(Gtk::Align::START);
ignore_outliers.set_hexpand(false);
ignore_outliers.set_vexpand(false);
ignore_outliers.set_active(_histogram_data->get_ignore_outliers());
ignore_outliers.property_active().signal_changed().connect([this, _histogram_data](){
_histogram_data->set_ignore_outliers(ignore_outliers.get_active());
});
attach(ignore_outliers, 1, 3, 1, 1);
label = Gtk::manage(new Gtk::Label("Number of bins"));
label->set_halign(Gtk::Align::END);
label->set_hexpand(false);
label->set_vexpand(false);
attach(*label, 2, 3, 1, 1);
nbins_spin.set_halign(Gtk::Align::START);
nbins_spin.set_hexpand(false);
nbins_spin.set_vexpand(false);
nbins_spin.set_wrap(true);
nbins_spin.set_snap_to_ticks(true);
nbins_spin.set_numeric(true);
nbins_spin.set_value(_histogram_data->get_nbins());
nbins_spin.signal_value_changed().connect([this, _histogram_data](){
_histogram_data->set_nbins(nbins_spin.get_value());
});
attach(nbins_spin, 3, 3, 1, 1);
label = Gtk::manage(new Gtk::Label("Bin minimum"));
label->set_halign(Gtk::Align::END);
label->set_hexpand(false);
label->set_vexpand(false);
attach(*label, 0, 4, 1, 1);
datmin_spin.set_halign(Gtk::Align::START);
datmin_spin.set_hexpand(false);
datmin_spin.set_vexpand(false);
datmin_spin.set_wrap(true);
datmin_spin.set_snap_to_ticks(true);
datmin_spin.set_numeric(true);
datmin_spin.set_value(_histogram_data->get_data_minimum());
datmin_spin.signal_value_changed().connect([this, _histogram_data](){
double value = datmin_spin.get_value();
_histogram_data->set_data_minimum(value);
double old_min, old_max;
datmax_spin.get_range(old_min, old_max);
datmax_spin.set_range(value + 0.01, old_max);
});
attach(datmin_spin, 1, 4, 1, 1);
label = Gtk::manage(new Gtk::Label("Bin maximum"));
label->set_halign(Gtk::Align::END);
label->set_hexpand(false);
label->set_vexpand(false);
attach(*label, 2, 4, 1, 1);
datmax_spin.set_halign(Gtk::Align::START);
datmax_spin.set_hexpand(false);
datmax_spin.set_vexpand(false);
datmax_spin.set_wrap(true);
datmax_spin.set_snap_to_ticks(true);
datmax_spin.set_numeric(true);
datmax_spin.set_value(_histogram_data->get_data_maximum());
datmax_spin.signal_value_changed().connect([this, _histogram_data](){
double value = datmax_spin.get_value();
_histogram_data->set_data_maximum(value);
double old_min, old_max;
datmin_spin.get_range(old_min, old_max);
datmin_spin.set_range(old_min, value - 0.01);
});
attach(datmax_spin, 3, 4, 1, 1);
}
};
class HistogramUnbinnedWithAddButtonTab : public HistogramUnbinnedTab {
private:
Gtk::Button add_data_button;
HistogramUnbinnedWithAddButtonTab() = delete;
public:
HistogramUnbinnedWithAddButtonTab(Gtk::PLplot::PlotDataHistogramUnbinned *_histogram_data, Glib::ustring x_title, Glib::ustring y_title, Glib::ustring plot_title, std::function<void()> add_data_function) :
HistogramUnbinnedTab(_histogram_data, x_title, y_title, plot_title),
add_data_button("Add 10 data points") {
add_data_button.set_hexpand(false);
add_data_button.set_halign(Gtk::Align::CENTER);
add_data_button.signal_clicked().connect(add_data_function);
attach(add_data_button, 0, 5, 4, 1);
}
};
class Window : public Gtk::Window {
private:
Gtk::Notebook notebook;
std::mt19937 gen;
std::normal_distribution<> d;
public:
Window() : notebook(), gen(1234), d(0, 1){
// general window and canvas settings
set_default_size(1024, 800);
set_title("Gtkmm-PLplot test12");
//add pages to notebook
// page1 -> PLplot example
std::valarray<double> data1 = sin(Gtk::PLplot::indgen_va(2047) * 2.0 * M_PI / 2047.0);
HistogramUnbinnedTab *tab1 =
Gtk::manage(
new HistogramUnbinnedTab(
Gtk::manage(
data1, -1.1, 1.1, 44
)
),
"#frValue", // #fr triggers Roman font...
"#frFrequency",
"#frPLplot Example 5 - Probability function of Oscillator"
)
);
// page2: Gaussian distribution
std::vector<double> data2;
for (size_t i = 0 ; i < 100 ; i++)
data2.push_back(d(gen));
Gtk::PLplot::PlotDataHistogramUnbinned *histogram_data2 = Gtk::manage(
data2, -5.0, 5, 10
)
);
HistogramUnbinnedTab *tab2 =
Gtk::manage(
new HistogramUnbinnedWithAddButtonTab(
histogram_data2,
"Value",
"Frequency",
"Normal distribution",
[histogram_data2, this](){ /* function that will be called whenever the add_data_button is clicked */
for (size_t i = 0 ; i < 10 ; i++)
histogram_data2->add_datapoint(d(gen));
}
)
);
std::valarray<double> data3_x = Gtk::PLplot::indgen_va(21) - 10.0;
std::valarray<double> data3_y = exp(-1.0 * data3_x * data3_x / 2.0) / sqrt(2.0 * M_PI);
Gtk::PLplot::PlotDataHistogramBinned *histogram_data3 = Gtk::manage(
data3_x, data3_y
)
);
HistogramBinnedTab *tab3 =
Gtk::manage(
new HistogramBinnedTab(
histogram_data3,
"Value",
"Frequency",
"Normal distribution"
)
);
// append pages
notebook.append_page(*tab1, "Histogram 1");
notebook.append_page(*tab2, "Histogram 2");
notebook.append_page(*tab3, "Histogram 3");
notebook.set_margin(10);
set_child(notebook);
}
};
}
int main(int argc, char **argv) {
Glib::set_application_name("gtkmm-plplot-test12");
Glib::RefPtr<Gtk::Application> app = Gtk::Application::create("eu.tomschoonjans.gtkmm-plplot-test12");
return app->make_window_and_run<Test12::Window>(argc, argv);
}
a class that will hold a single binned histogram dataset and its properties for a PlotHistogram plot
Definition plotdatahistogrambinned.h:38
void set_centred(bool centred)
bool get_centred()
abstract base class that will hold a single dataset that can be rendered as a histogram
Definition plotdatahistogram.h:33
void set_expand_bins(bool expand_bins)
double get_data_maximum()
void set_empty_bins(bool empty_bins)
bool get_expand_bins()
bool get_empty_bins()
int get_nbins()
double get_data_minimum()
a class that will hold a single unbinned histogram dataset and its properties for a PlotHistogram plo...
Definition plotdatahistogramunbinned.h:38
void set_nbins(int nbins)
void set_data_minimum(double datmin)
void set_ignore_outliers(bool ignore_outliers)
virtual void add_datapoint(double value)
void set_data_maximum(double datmax)
bool get_ignore_outliers()
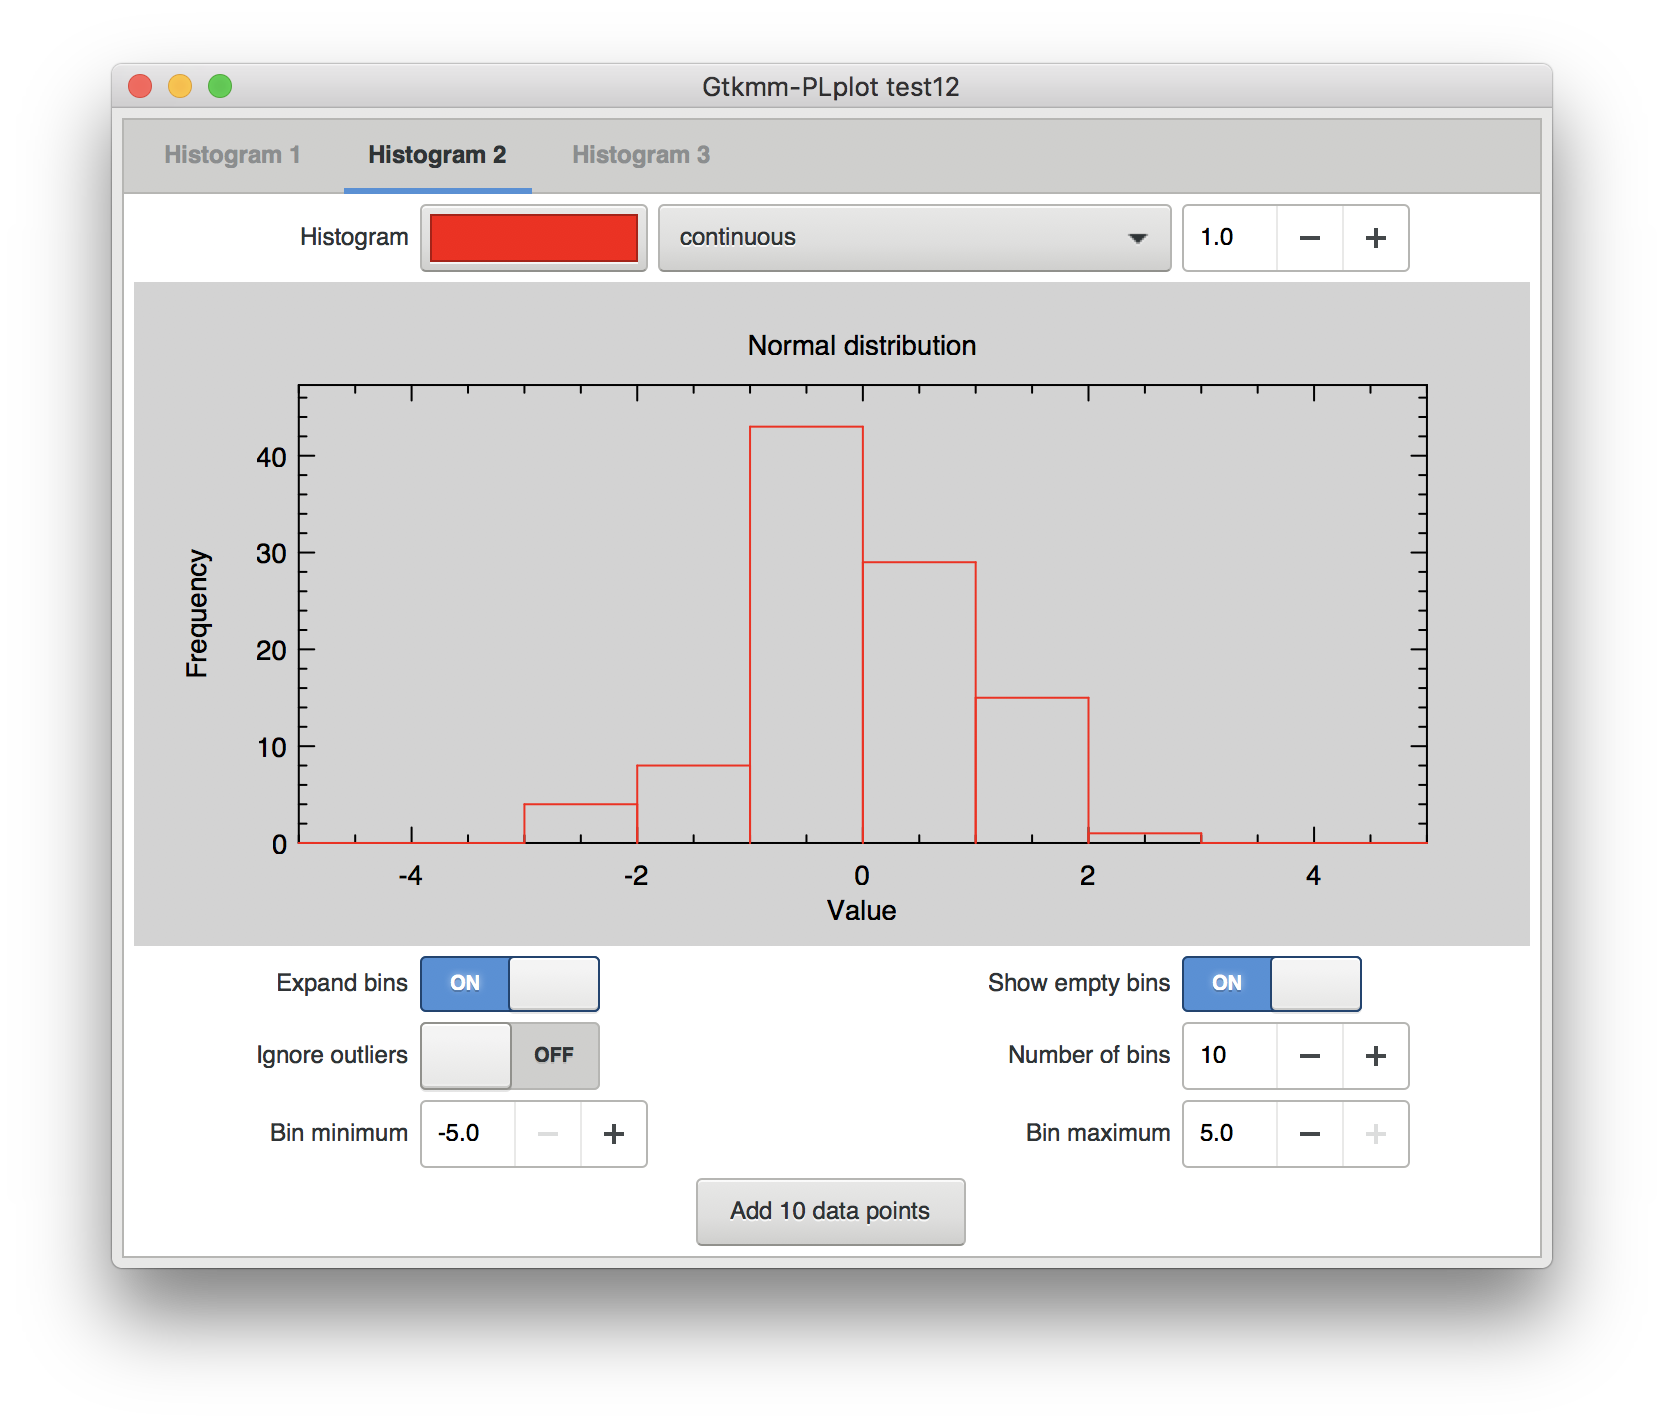
Example 12
Example 13: Dates and times
/*
Copyright (C) 2018 Rémi BERTHO
This program is free software: you can redistribute it and/or modify
it under the terms of the GNU Lesser General Public License as published by
the Free Software Foundation, either version 3 of the License, or
(at your option) any later version.
This program is distributed in the hope that it will be useful,
but WITHOUT ANY WARRANTY; without even the implied warranty of
MERCHANTABILITY or FITNESS FOR A PARTICULAR PURPOSE. See the
GNU Lesser General Public License for more details.
You should have received a copy of the GNU Lesser General Public License
along with this program. If not, see <http://www.gnu.org/licenses/>.
*/
#include "gtkmm-plplot.h"
#include <gtkmm/application.h>
#include <gtkmm/aspectframe.h>
#include <glibmm/miscutils.h>
#include <gtkmm/window.h>
#include <gtkmm/grid.h>
#include <gtkmm/box.h>
#include <gtkmm/checkbutton.h>
#include <iostream>
#include <glib.h>
#include <glibmm/date.h>
#ifndef M_PI
#define M_PI (3.14159265358979323846)
#endif
namespace Test13 {
class Window : public Gtk::Window {
private:
Gtk::PLplot::Canvas canvas;
Gtk::Grid grid;
Gtk::PLplot::Plot2D *plot = nullptr;
Gtk::Box box;
Gtk::CheckButton button_1;
Gtk::CheckButton button_2;
Gtk::CheckButton button_3;
void add_plot_1() {
if (!button_1.get_active())
return;
if (plot != nullptr) {
canvas.remove_plot(*plot);
plot = nullptr;
}
// Data points every 10 minutes for 1 day
int npts = 73;
std::valarray<double> x_va(npts), y_va(npts);
double xmax = 60.0 * 60.0 * 24.0; // Number of seconds in a day
for (int i = 0 ; i < npts ; i++) {
x_va[i] = xmax * ( (double) i / (double) npts );
y_va[i] = 15.0 - 5.0 * cos( 2 * M_PI * ( (double) i / (double) npts ) );
}
auto plot_data = Gtk::manage(new Gtk::PLplot::PlotData2D(x_va, y_va, Gdk::RGBA("blue"), Gtk::PLplot::LineStyle::LONG_DASH_LONG_GAP, 5.0));
plot = Gtk::manage(new Gtk::PLplot::Plot2D(*plot_data));
plot->set_axis_time_format_x("%H:%M");
canvas.add_plot(*plot);
plot->hide_legend();
}
void add_plot_2() {
if (!button_2.get_active())
return;
if (plot != nullptr){
canvas.remove_plot(*plot);
plot = nullptr;
}
int npts = 365;
std::valarray<double> y_va(npts);
std::valarray<double> x_va(npts);
Glib::DateTime first_date = Glib::DateTime::create_local(2010, 1,1,0,0,0);
for (int i = 0 ; i < npts ; i++) {
x_va[i] = first_date.add_days(i).to_unix();
y_va[i] = 15.0 - 5.0 * cos( 2 * M_PI * ( (double) i / (double) (npts/12) ) );
}
plot = Gtk::manage(new Gtk::PLplot::Plot2D(*plot_data));
plot->set_axis_time_format_x("%D");
canvas.add_plot(*plot);
plot->hide_legend();
}
void add_plot_3() {
if (!button_3.get_active())
return;
if (plot != nullptr){
canvas.remove_plot(*plot);
plot = nullptr;
}
int npts = 2018;
std::valarray<double> y_va(npts);
std::valarray<double> x_va(npts);
for (int i = 0 ; i < npts ; i++) {
x_va[i] = i;
y_va[i] = 15.0 - 5.0 * cos( 2 * M_PI * ( (double) i / (double) (npts/10) ) );
}
plot = Gtk::manage(new Gtk::PLplot::Plot2D(*plot_data));
plot->set_axis_time_format_x("%Y");
plot->config_time_x(365.25, Glib::DateTime::create_local(1, 1,1,0,0,0));
canvas.add_plot(*plot);
plot->hide_legend();
}
public:
Window() : canvas() {
const int width = 720, height = 580;
set_default_size(width, height);
set_title("Gtkmm-PLplot test13");
canvas.set_hexpand(true);
canvas.set_vexpand(true);
canvas.set_focusable(true);
Gtk::AspectFrame geometry(Gtk::Align::CENTER, Gtk::Align::CENTER, float(width)/float(height), false);
geometry.set_child(canvas);
box.set_homogeneous ();
box.set_halign(Gtk::Align::CENTER);
box.get_style_context()->add_class("linked");
button_1.set_label("Test 1");
button_1.signal_toggled().connect(sigc::mem_fun(*this, &Window::add_plot_1));
button_2.set_label("Test 2");
button_2.set_group(button_1);
button_2.signal_toggled().connect(sigc::mem_fun(*this, &Window::add_plot_2));
button_3.set_label("Test 3");
button_3.set_group(button_1);
button_3.signal_toggled().connect(sigc::mem_fun(*this, &Window::add_plot_3));
box.append(button_1);
box.append(button_2);
box.append(button_3);
button_1.set_active(true);
grid.attach(box, 0, 0, 1, 1);
grid.attach(geometry, 0, 1, 1, 1);
grid.set_row_spacing(5);
grid.set_column_spacing(5);
grid.set_column_homogeneous(false);
grid.set_margin(10);
set_child(grid);
}
virtual ~Window() {}
};
}
int main(int argc, char *argv[]) {
Glib::set_application_name("gtkmm-plplot-test13");
Glib::RefPtr<Gtk::Application> app = Gtk::Application::create("eu.tomschoonjans.gtkmm-plplot-test13");
return app->make_window_and_run<Test13::Window>(argc, argv);
}
void config_time_x(double scale, const Glib::DateTime &time)
void set_axis_time_format_x(Glib::ustring time_format)
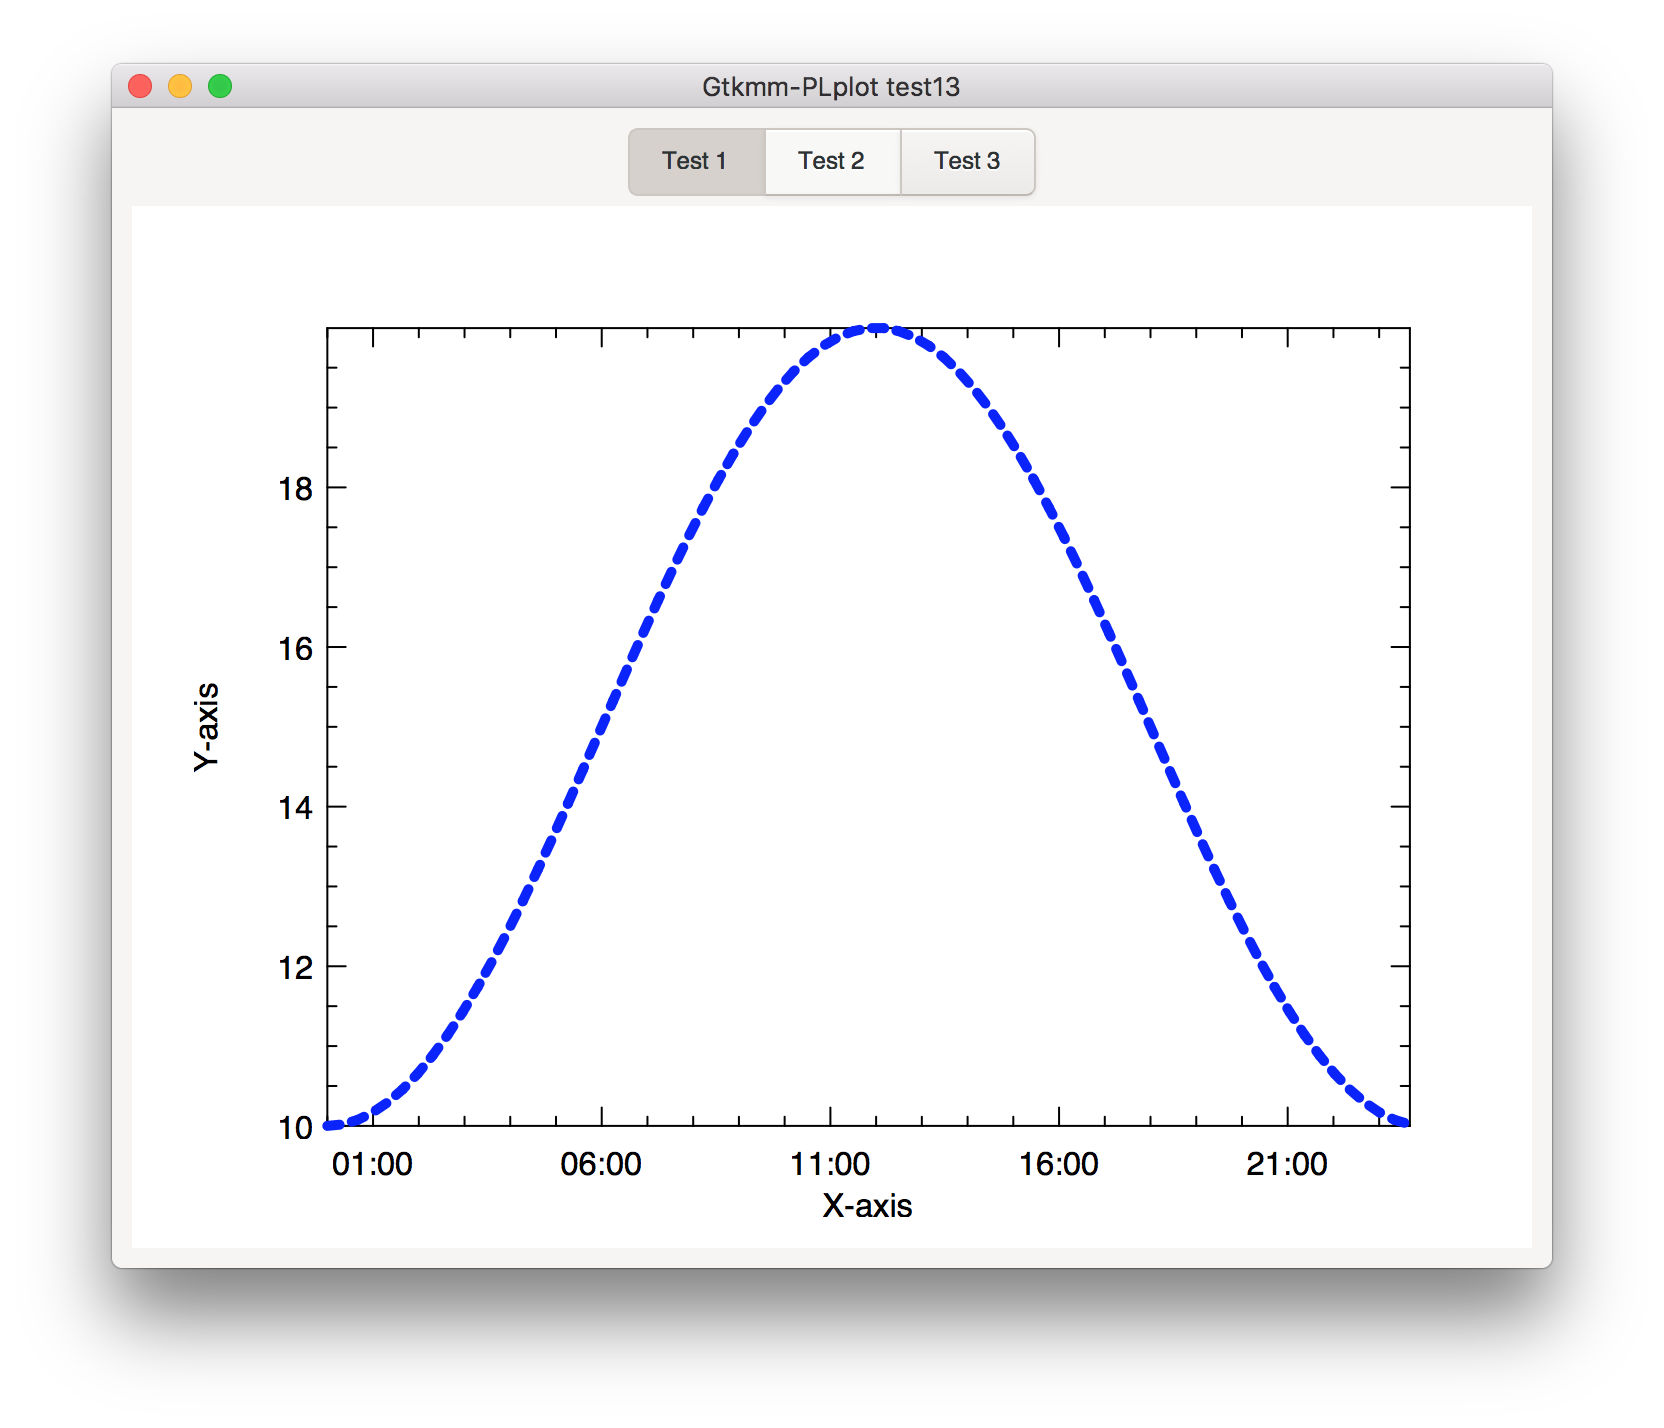
Example 13