|
| | PlotContourShades (PlotDataSurface &data, const Glib::ustring &axis_title_x="X-axis", const Glib::ustring &axis_title_y="Y-axis", const Glib::ustring &plot_title="", unsigned int nlevels=6, ColormapPalette colormap_palette=BLUE_YELLOW, Gdk::RGBA edge_color=Gdk::RGBA("black"), double edge_width=PLOTDATA_DEFAULT_LINE_WIDTH, const double plot_width_norm=1.0, const double plot_height_norm=1.0, const double plot_offset_horizontal_norm=0.0, const double plot_offset_vertical_norm=0.0) |
| |
| virtual | ~PlotContourShades () |
| |
| void | show_colorbar () |
| |
| void | hide_colorbar () |
| |
| bool | is_showing_colorbar () |
| |
| void | set_colorbar_title (Glib::ustring colorbar_title) |
| |
| Glib::ustring | get_colorbar_title () |
| |
| void | set_colormap_palette (ColormapPalette colormap) |
| |
| ColormapPalette | get_colormap_palette () |
| |
| void | set_area_fill_pattern (AreaFillPattern area_fill_pattern) |
| |
| AreaFillPattern | get_area_fill_pattern () |
| |
| void | set_area_lines_width (double width) |
| |
| double | get_area_lines_width () |
| |
| void | show_edges () |
| |
| void | hide_edges () |
| |
| bool | is_showing_edges () |
| |
| virtual void | draw_colorbar (const Cairo::RefPtr< Cairo::Context > &cr, plstream *pls) |
| |
| virtual void | draw_plot (const Cairo::RefPtr< Cairo::Context > &cr, const int width, const int height) override |
| |
| | PlotContour (PlotDataSurface &data, const Glib::ustring &axis_title_x="X-axis", const Glib::ustring &axis_title_y="Y-axis", const Glib::ustring &plot_title="", unsigned int nlevels=6, Gdk::RGBA edge_color=Gdk::RGBA("red"), double edge_width=PLOTDATA_DEFAULT_LINE_WIDTH, const double plot_width_norm=1.0, const double plot_height_norm=1.0, const double plot_offset_horizontal_norm=0.0, const double plot_offset_vertical_norm=0.0) |
| |
| virtual | ~PlotContour () |
| |
| void | set_edge_color (Gdk::RGBA color) |
| |
| Gdk::RGBA | get_edge_color () |
| |
| void | set_edge_width (double width) |
| |
| double | get_edge_width () |
| |
| void | set_nlevels (unsigned int nlevels) |
| |
| unsigned int | get_nlevels () |
| |
| void | show_labels () |
| |
| void | hide_labels () |
| |
| bool | is_showing_labels () const |
| |
| virtual | ~Plot () |
| |
| virtual void | remove_data (unsigned int plot_data_index) |
| |
| virtual void | remove_data (PlotData &plot_data_member) |
| |
| virtual void | remove_object (unsigned int plot_object_index) |
| |
| virtual void | remove_object (PlotObject &plot_object_member) |
| |
| virtual PlotData * | get_data (unsigned int data_index=0) final |
| |
| void | set_axis_title_x (Glib::ustring title) |
| |
| void | set_axis_title_y (Glib::ustring title) |
| |
| Glib::ustring | get_axis_title_x () |
| |
| Glib::ustring | get_axis_title_y () |
| |
| void | set_plot_title (Glib::ustring title) |
| |
| Glib::ustring | get_plot_title () |
| |
| void | show () |
| |
| void | hide () |
| |
| bool | is_showing () const |
| |
| Gdk::RGBA | get_background_color () |
| |
| void | set_background_color (Gdk::RGBA color) |
| |
| Gdk::RGBA | get_axes_color () |
| |
| void | set_axes_color (Gdk::RGBA color) |
| |
| Gdk::RGBA | get_titles_color () |
| |
| void | set_titles_color (Gdk::RGBA color) |
| |
| sigc::signal< void(void)> | signal_changed () |
| |
| sigc::signal< void(PlotData *)> | signal_data_added () |
| |
| sigc::signal< void(PlotData *)> | signal_data_removed () |
| |
| sigc::signal< void(PlotObject *)> | signal_object_added () |
| |
| sigc::signal< void(PlotObject *)> | signal_object_removed () |
| |
| virtual void | set_manage () |
| |
| virtual | ~RegionSelection () |
| |
| void | set_region (double xmin, double xmax, double ymin, double ymax) |
| |
| void | get_region (double &xmin, double &xmax, double &ymin, double &ymax) |
| |
| bool | get_region_selectable () |
| |
| void | set_region_selectable (bool selectable=true) |
| |
| bool | get_region_zoomable () |
| |
| void | set_region_zoomable (bool zoomable=true) |
| |
| double | get_region_zoom_scale_factor () |
| |
| void | set_region_zoom_scale_factor (double scale_factor) |
| |
| Gdk::RGBA | get_region_selection_color () |
| |
| void | set_region_selection_color (Gdk::RGBA color) |
| |
| double | get_region_selection_width () |
| |
| void | set_region_selection_width (double line_width) |
| |
| bool | get_region_pannable () |
| |
| void | set_region_pannable (bool pannable=true) |
| |
| sigc::signal< void(double, double, double, double)> | signal_select_region () |
| |
| sigc::signal< void(double, double)> | signal_cursor_motion () |
| |
| sigc::signal< void(double, double)> | signal_cursor_enter () |
| |
| sigc::signal< void(void)> | signal_cursor_leave () |
| |
| sigc::signal< std::vector< double >(double, double, double, double)> | signal_pan () |
| |
| sigc::signal< void(double, double)> | signal_double_press () |
| |
| sigc::signal< void(double, double, GdkScrollDirection)> | signal_zoom_region () |
| |
|
| | PlotContourShades (const Glib::ustring &axis_title_x, const Glib::ustring &axis_title_y, const Glib::ustring &plot_title, unsigned int nlevels, ColormapPalette colormap_palette, Gdk::RGBA edge_color, double edge_width, const double plot_width_norm, const double plot_height_norm, const double plot_offset_horizontal_norm, const double plot_offset_vertical_norm) |
| |
| virtual void | plot_data_modified () override |
| | a method that will update the _range variables when datasets are added, modified or removed.
|
| |
| | PlotContour (const Glib::ustring &axis_title_x, const Glib::ustring &axis_title_y, const Glib::ustring &plot_title, unsigned int nlevels, Gdk::RGBA edge_color, double edge_width, const double plot_width_norm, const double plot_height_norm, const double plot_offset_horizontal_norm, const double plot_offset_vertical_norm) |
| |
| virtual void | add_data (PlotDataSurface &data) |
| |
| virtual void | on_changed () |
| |
| virtual void | on_data_added (PlotData *new_data) |
| |
| virtual void | on_data_removed (PlotData *removed_data) |
| |
| virtual void | on_object_added (PlotObject *new_object) |
| |
| virtual void | on_object_removed (PlotObject *removed_object) |
| |
| virtual void | draw_plot_init (const Cairo::RefPtr< Cairo::Context > &cr, const int width, const int height) final |
| |
| | Plot (const Glib::ustring &axis_title_x, const Glib::ustring &axis_title_y, const Glib::ustring &plot_title, const double plot_width_norm, const double plot_height_norm, const double plot_offset_horizontal_norm, const double plot_offset_vertical_norm) |
| |
| | Object () |
| |
| virtual void | coordinate_transform_plplot_to_cairo (double x_pl, double y_pl, double &x_cr, double &y_cr) final |
| |
| virtual void | coordinate_transform_cairo_to_plplot (double x_cr, double y_cr, double &x_pl, double &y_pl) final |
| |
| virtual void | coordinate_transform_world_to_cairo (double x_wr, double y_wr, double &x_cr, double &y_cr) final |
| |
| virtual void | coordinate_transform_cairo_to_world (double x_cr, double y_cr, double &x_wr, double &y_wr) final |
| |
| virtual void | coordinate_transform_world_to_plplot (double x_wr, double y_wr, double &x_pl, double &y_pl) |
| |
| virtual void | coordinate_transform_plplot_to_world (double x_pl, double y_pl, double &x_wr, double &y_wr) |
| |
| virtual void | on_select_region (double xmin, double xmax, double ymin, double ymax) |
| |
| virtual void | on_zoom_region (double x, double y, GdkScrollDirection direction) |
| |
| virtual void | on_cursor_motion (double x, double y) |
| |
| virtual void | on_cursor_enter (double x, double y) |
| |
| virtual void | on_cursor_leave () |
| |
| virtual std::vector< double > | on_pan (double old_x, double old_y, double new_x, double new_y) |
| |
| virtual void | on_double_press (double x, double y) |
| |
| | RegionSelection () |
| |
| | RegionSelection (const RegionSelection ®ion_selection)=default |
| |
|
| static void | ensure_valid_range (double &val0, double &val1) |
| | internal function that ensures valid ranges are always plotted, mostly avoiding case where for either x or y, data min is equal to data max.
|
| |
| unsigned int | nlevels |
| | Number of contour levels to draw.
|
| |
| Gdk::RGBA | edge_color |
| | Defines pen color used for contours defining edges.
|
| |
| double | edge_width |
| | Defines line width used for contours defining edges.
|
| |
| bool | showing_labels |
| | true will draw the contour labels, false hides them
|
| |
| double | zmin |
| | Minimum of z, used to determine the contour edges.
|
| |
| double | zmax |
| | Maximum of z, used to determine the contour edges.
|
| |
| std::vector< double > | clevels |
| | Vector containing the data levels corresponding to the edges of each region that will be plotted. To work properly the levels should be monotonic.
|
| |
| std::vector< PlotData * > | plot_data |
| | vector that contains pointers to the PlotData datasets
|
| |
| std::vector< PlotObject * > | plot_objects |
| | vector that contains pointers to the PlotObject datasets
|
| |
| Glib::ustring | axis_title_x |
| | X-axis title.
|
| |
| Glib::ustring | axis_title_y |
| | Y-axis title.
|
| |
| Glib::ustring | plot_title |
| | Plot title.
|
| |
| plstream * | pls |
| | the plstream object that will ensure the connection with PLplot
|
| |
| int | canvas_width |
| | the width of the canvas in Cairo units
|
| |
| int | canvas_height |
| | the height of the canvas in Cairo units
|
| |
| int | plot_offset_x |
| | the offset of the plot with respect to the top left corner of the canvas, measured along the horizontal (X-) axis in Cairo units
|
| |
| int | plot_offset_y |
| | the offset of the plot with respect to the top left corner of the canvas, measured along the vertical (Y-) axis in Cairo units
|
| |
| int | plot_width |
| | the current width of the plot in Cairo units
|
| |
| int | plot_height |
| | the current height of the plot in Cairo units
|
| |
| bool | shown |
| | true means the plot is currently visible, false means it is not plotted
|
| |
| Gdk::RGBA | background_color |
| | the currently used background color of the plot (default = fully transparent white, meaning that the background will be determined by the canvas)
|
| |
| const double | plot_width_norm |
| | the normalized plot width, calculated relative to the canvas width
|
| |
| const double | plot_height_norm |
| | the normalized plot height, calculated relative to the canvas height
|
| |
| const double | plot_offset_horizontal_norm |
| | the normalized horizontal offset from the canvas top left corner, calculated relative to the canvas width
|
| |
| const double | plot_offset_vertical_norm |
| | the normalized vertical offset from the canvas top left corner, calculated relative to the canvas height
|
| |
| Gdk::RGBA | axes_color |
| | the currently used color to draw the axes, the box and gridlines. Default is opaque black
|
| |
| Gdk::RGBA | titles_color |
| | the currently used color to draw the axes and plot titles. Default is opaque black
|
| |
| sigc::signal< void(void)> | _signal_changed |
| | signal that gets emitted whenever any of the plot parameters, or any of the contained PlotData datasets is changed.
|
| |
| sigc::signal< void(PlotData *)> | _signal_data_added |
| | signal emitted whenever a PlotData dataset is added to the plot
|
| |
| sigc::signal< void(PlotData *)> | _signal_data_removed |
| | signal emitted whenever data is removed from the plot.
|
| |
| sigc::signal< void(PlotObject *)> | _signal_object_added |
| | signal emitted whenever a PlotObject is added to the plot
|
| |
| sigc::signal< void(PlotObject *)> | _signal_object_removed |
| | signal emitted whenever a PlotObject is removed from the plot.
|
| |
| double | cairo_range_x [2] |
| | the current range shown on the plot for the X-axis in Cairo coordinates
|
| |
| double | cairo_range_y [2] |
| | the current range shown on the plot for the Y-axis in Cairo coordinates
|
| |
| double | plotted_range_x [2] |
| | the current range shown on the plot for the X-axis in PLplot coordinates (NOT world!!!)
|
| |
| double | plotted_range_y [2] |
| | the current range shown on the plot for the Y-axis in PLplot coordinates (NOT world!!!)
|
| |
| double | plot_data_range_x [2] |
| | the maximum range covered by the X-values of the datasets in PLplot coordinates (NOT world!!!)
|
| |
| double | plot_data_range_y [2] |
| | the maximum range covered by the Y-values of the datasets in PLplot coordinates (NOT world!!!)
|
| |
| sigc::signal< void(double, double, double, double)> | _signal_select_region |
| | signal that gets emitted whenever a new region was selected using the mouse pointer in Canvas::on_button_release_event()
|
| |
| sigc::signal< void(double, double, GdkScrollDirection)> | _signal_zoom_region |
| | signal that gets emitted whenever one zooms in on the plot using the mouse scroll wheel in Canvas::on_scroll_event()
|
| |
| sigc::signal< void(double, double)> | _signal_cursor_motion |
| | signal that will be emitted whenever the cursor (usually the mouse) is moved.
|
| |
| sigc::signal< void(double, double)> | _signal_cursor_enter |
| | signal that will be emitted whenever the cursor (usually the mouse) enter.
|
| |
| sigc::signal< void(void)> | _signal_cursor_leave |
| | signal that will be emitted whenever the cursor (usually the mouse) leave.
|
| |
| sigc::signal< std::vector< double >(double, double, double, double)> | _signal_pan |
| | signal that will be emitted whenever the cursor is moved within a pannable plot while the SHIFT key is pressed in and the left mouse button is pressed.
|
| |
| sigc::signal< void(double, double)> | _signal_double_press |
| | signal that will emitted whenever a double mouse-click event was recorded within the plot box. Default response will be to reset the region to a range determined by the minima and maxima of the X- and Y- datasets.
|
| |
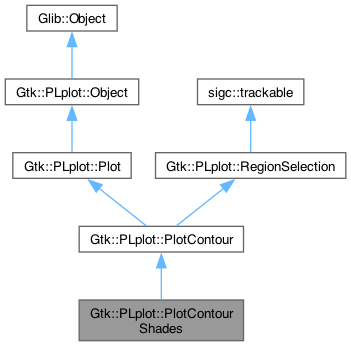
a class for contour plots with shaded regions.
A class for contour plots with shaded regions. Construction requires a single PlotDataSurface dataset, and no datasets may be added afterwards. This class offers one property on top of those offered by parent class Plot: whether to draw a colorbar or not. Important is that whenever a property is changed, signal_changed() is emitted, which will eventually be picked up by the canvas that will hold the plot. For more information, the reader is referred to example Example 8: a Shaded contour plot.
 Public Member Functions inherited from Gtk::PLplot::PlotContour