a class providing support for selecting a region in a plot More...
#include <gtkmm-plplot/regionselection.h>
Public Member Functions | |
| virtual | ~RegionSelection () |
| void | set_region (double xmin, double xmax, double ymin, double ymax) |
| void | get_region (double &xmin, double &xmax, double &ymin, double &ymax) |
| bool | get_region_selectable () |
| void | set_region_selectable (bool selectable=true) |
| bool | get_region_zoomable () |
| void | set_region_zoomable (bool zoomable=true) |
| double | get_region_zoom_scale_factor () |
| void | set_region_zoom_scale_factor (double scale_factor) |
| Gdk::RGBA | get_region_selection_color () |
| void | set_region_selection_color (Gdk::RGBA color) |
| double | get_region_selection_width () |
| void | set_region_selection_width (double line_width) |
| bool | get_region_pannable () |
| void | set_region_pannable (bool pannable=true) |
| sigc::signal< void(double, double, double, double)> | signal_select_region () |
| sigc::signal< void(double, double)> | signal_cursor_motion () |
| sigc::signal< void(double, double)> | signal_cursor_enter () |
| sigc::signal< void(void)> | signal_cursor_leave () |
| sigc::signal< std::vector< double >(double, double, double, double)> | signal_pan () |
| sigc::signal< void(double, double)> | signal_double_press () |
| sigc::signal< void(double, double, GdkScrollDirection)> | signal_zoom_region () |
Protected Member Functions | |
| virtual void | coordinate_transform_plplot_to_cairo (double x_pl, double y_pl, double &x_cr, double &y_cr) final |
| virtual void | coordinate_transform_cairo_to_plplot (double x_cr, double y_cr, double &x_pl, double &y_pl) final |
| virtual void | coordinate_transform_world_to_cairo (double x_wr, double y_wr, double &x_cr, double &y_cr) final |
| virtual void | coordinate_transform_cairo_to_world (double x_cr, double y_cr, double &x_wr, double &y_wr) final |
| virtual void | coordinate_transform_world_to_plplot (double x_wr, double y_wr, double &x_pl, double &y_pl) |
| virtual void | coordinate_transform_plplot_to_world (double x_pl, double y_pl, double &x_wr, double &y_wr) |
| virtual void | on_select_region (double xmin, double xmax, double ymin, double ymax) |
| virtual void | on_zoom_region (double x, double y, GdkScrollDirection direction) |
| virtual void | on_cursor_motion (double x, double y) |
| virtual void | on_cursor_enter (double x, double y) |
| virtual void | on_cursor_leave () |
| virtual std::vector< double > | on_pan (double old_x, double old_y, double new_x, double new_y) |
| virtual void | on_double_press (double x, double y) |
| RegionSelection () | |
| RegionSelection (const RegionSelection ®ion_selection)=default | |
Static Protected Member Functions | |
| static void | ensure_valid_range (double &val0, double &val1) |
| internal function that ensures valid ranges are always plotted, mostly avoiding case where for either x or y, data min is equal to data max. | |
Protected Attributes | |
| double | cairo_range_x [2] |
| the current range shown on the plot for the X-axis in Cairo coordinates | |
| double | cairo_range_y [2] |
| the current range shown on the plot for the Y-axis in Cairo coordinates | |
| double | plotted_range_x [2] |
| the current range shown on the plot for the X-axis in PLplot coordinates (NOT world!!!) | |
| double | plotted_range_y [2] |
| the current range shown on the plot for the Y-axis in PLplot coordinates (NOT world!!!) | |
| double | plot_data_range_x [2] |
| the maximum range covered by the X-values of the datasets in PLplot coordinates (NOT world!!!) | |
| double | plot_data_range_y [2] |
| the maximum range covered by the Y-values of the datasets in PLplot coordinates (NOT world!!!) | |
| sigc::signal< void(double, double, double, double)> | _signal_select_region |
| signal that gets emitted whenever a new region was selected using the mouse pointer in Canvas::on_button_release_event() | |
| sigc::signal< void(double, double, GdkScrollDirection)> | _signal_zoom_region |
| signal that gets emitted whenever one zooms in on the plot using the mouse scroll wheel in Canvas::on_scroll_event() | |
| sigc::signal< void(double, double)> | _signal_cursor_motion |
| signal that will be emitted whenever the cursor (usually the mouse) is moved. | |
| sigc::signal< void(double, double)> | _signal_cursor_enter |
| signal that will be emitted whenever the cursor (usually the mouse) enter. | |
| sigc::signal< void(void)> | _signal_cursor_leave |
| signal that will be emitted whenever the cursor (usually the mouse) leave. | |
| sigc::signal< std::vector< double >(double, double, double, double)> | _signal_pan |
| signal that will be emitted whenever the cursor is moved within a pannable plot while the SHIFT key is pressed in and the left mouse button is pressed. | |
| sigc::signal< void(double, double)> | _signal_double_press |
| signal that will emitted whenever a double mouse-click event was recorded within the plot box. Default response will be to reset the region to a range determined by the minima and maxima of the X- and Y- datasets. | |
Private Attributes | |
| bool | region_selectable |
true indicates that a region on the plot can be selected by dragging a box with the mouse button pressed in when showing, or if double mouse button pressed event zooms out, false means not possible. The default is true | |
| bool | region_zoomable |
true indicates that one can zoom in on a region on the plot by using the mouse scroll wheel (or trackpad), false means not possible. The default is true | |
| bool | region_pannable |
true indicates that one can pan a plot around by simultaneously pressing Shift and the left mouse button while moving the mouse cursor around. false means not possible. The default is true | |
| double | region_zoom_scale_factor |
| scale factor that will be used for scroll wheel based zooming | |
| Gdk::RGBA | region_selection_color |
| color that will be used to draw the selection box | |
| double | region_selection_width |
| width of the selection box frame | |
Friends | |
| class | Canvas |
Detailed Description
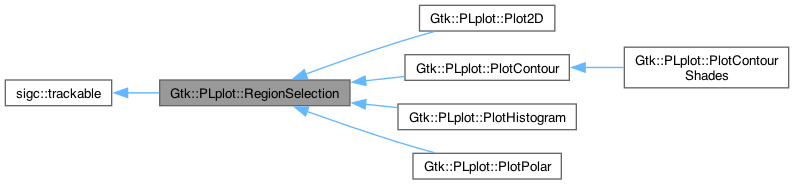
a class providing support for selecting a region in a plot
Several plot classes (Plot2D, PlotPolar, PlotContour and PlotContourShades) that represent data in a two-dimensional grid inherit from this class, allowing users to drag a selection box using a mouse gesture (mouse button press, drag, mouse button release), to zoom in or out by using the scroll button, or to pan the plotdata around in its plot box by pressing in Shift and pressing the left mouse button in, while moving the mouse around. The default signal handler will initiate a redrawing of the plot, with the visible region set to correspond to the initially drawn box. This is shown in Example 1: Plot data properties and zooming and others.
- Coordinate systems
Anyone interested in deriving this library (or classes that inherit from RegionSelection), will notice that there are three coordinate systems in use.
- Cairo coordinates: the coordinate system used by the Cairo library. All events generated on the Canvas have a corresponding position of where the event was triggered, which will be converted to world coordinates before Gtkmm-PLplot signals are emitted.
- PLplot coordinates: the coordinate system used by the PLplot library. Though PLplot supports polar and logarithmic axes and coordinate systems, it has a funny way of doing so, since all data passed to PLplot functions must be according to a traditional Cartesian coordinate system.
- World coordinates: the coordinate system as it is shown on the Plot. Unless using a Plot2D in logarithmic mode or using PlotPolar, PLplot coordinates and world coordinates are identical.
Methods have been provided that allow for coordinate transformations between these three coordinate systems. Regular users of the library (not hackers!), will only ever be dealing with the World coordinate system, as all transformations are taken care of by Gtkmm-PLplot.
Constructor & Destructor Documentation
◆ RegionSelection() [1/2]
|
protected |
Constructor
◆ RegionSelection() [2/2]
|
protecteddefault |
Copy constructor
- Parameters
-
region_selection copy source
◆ ~RegionSelection()
|
virtual |
Destructor
Member Function Documentation
◆ coordinate_transform_cairo_to_plplot()
|
finalprotectedvirtual |
◆ coordinate_transform_cairo_to_world()
|
finalprotectedvirtual |
Transform Cairo coordinate system coordinates to World
This method cannot be overridden in derived classed.
- Parameters
-
x_cr Cairo X-coordinate y_cr Cairo Y-coordinate x_wr World X-coordinate y_wr World Y-coordinate
- Since
- 2.2
◆ coordinate_transform_plplot_to_cairo()
|
finalprotectedvirtual |
◆ coordinate_transform_plplot_to_world()
|
protectedvirtual |
Transform PLplot coordinate system coordinates to world
This method takes care of coordinate transformations when using non-linear axes When a plot has logarithmic axes or polar plot style, PLplot requires the user to transform the dataset into the linear cartesian coordinate system which it uses internally. The default implementation does returns output coordinates that is identical to the input.
- Parameters
-
x_pl the xPLplot coordinate to be transformedy_pl the yPLplot coordinate to be transformedx_wr the new xworld coordinatey_wr the new yworld coordinate
Reimplemented in Gtk::PLplot::Plot2D, and Gtk::PLplot::PlotPolar.
◆ coordinate_transform_world_to_cairo()
|
finalprotectedvirtual |
Transform World coordinate system coordinates to Cairo
This method cannot be overridden in derived classed.
- Parameters
-
x_wr World X-coordinate y_wr World Y-coordinate x_cr Cairo X-coordinate y_cr Cairo Y-coordinate
- Since
- 2.2
◆ coordinate_transform_world_to_plplot()
|
protectedvirtual |
Transform World coordinate system coordinates to PLplot
This method takes care of coordinate transformations when using non-linear axes When a plot has logarithmic axes or polar plot style, PLplot requires the user to transform the dataset into the linear cartesian coordinate system which it uses internally. The default implementation does returns output coordinates that is identical to the input.
- Parameters
-
x_wr the xworld coordinate to be transformedy_wr the yworld coordinate to be transformedx_pl the new xPLplot coordinatey_pl the new yPLplot coordinate
Reimplemented in Gtk::PLplot::Plot2D, and Gtk::PLplot::PlotPolar.
◆ ensure_valid_range()
|
staticprotected |
internal function that ensures valid ranges are always plotted, mostly avoiding case where for either x or y, data min is equal to data max.
◆ get_region()
| void Gtk::PLplot::RegionSelection::get_region | ( | double & | xmin, |
| double & | xmax, | ||
| double & | ymin, | ||
| double & | ymax | ||
| ) |
Get the currently visible plotted region
(xmin, ymin) corresponds to the World coordinates of the lower left corner of the visible region, while (xmax, ymax) corresponds to the World coordinates of the upper right corner of the visible region.
- Parameters
-
xmin left X-coordinate xmax right X-coordinate ymin lower Y-coordinate ymax upper Y-coordinate
- Exceptions
-
Gtk::PLplot::Exception
◆ get_region_pannable()
| bool Gtk::PLplot::RegionSelection::get_region_pannable | ( | ) |
Get whether plotdata can be panned on the plot by clicking the left mouse button and the shift key
- Returns
trueif plotdate is draggable in the plot,falseif not
- Since
- 2.2
◆ get_region_selectable()
| bool Gtk::PLplot::RegionSelection::get_region_selectable | ( | ) |
Get whether regions can be selected on the plot by dragging the mouse while the button is clicked in.
- Returns
trueif a region is selectable in the plot,falseif not
◆ get_region_selection_color()
| Gdk::RGBA Gtk::PLplot::RegionSelection::get_region_selection_color | ( | ) |
Gets the currently used selection box color
The default color is black
- Returns
- the currently used selection box color
- Since
- 2.2
◆ get_region_selection_width()
| double Gtk::PLplot::RegionSelection::get_region_selection_width | ( | ) |
Gets the currently used selection box line width
The default width is 2.0
- Returns
- the currently used selection box width
- Since
- 2.2
◆ get_region_zoom_scale_factor()
| double Gtk::PLplot::RegionSelection::get_region_zoom_scale_factor | ( | ) |
Gets the currently used zoom scale factor
The default value is 2.0. If a value lower than 1.0 is chosen, zoom-in and zoom-out will exchange behavior.
- Returns
- the currently used zoom scale factor
- Since
- 2.2
◆ get_region_zoomable()
| bool Gtk::PLplot::RegionSelection::get_region_zoomable | ( | ) |
Get whether regions can be selected on the plot by scrolling the mouse wheel (or trackpad)
- Returns
trueif a region is zoomable in the plot,falseif not
- Since
- 2.2
◆ on_cursor_enter()
|
protectedvirtual |
This is a default handler for signal_cursor_enter()
This signal is emitted whenever the cursor (usually the mouse) is enter within the plot. x and y correspond to the new data coordinates. Currently this method does nothing, and users are encouraged to write their own signal handler or override the method in a new class.
- Parameters
-
x The X-value corresponding to the current cursor position y The Y-value corresponding to the current cursor position
◆ on_cursor_leave()
|
protectedvirtual |
This is a default handler for signal_cursor_enter()
This signal is emitted whenever the cursor (usually the mouse) leave the plot. Currently this method does nothing, and users are encouraged to write their own signal handler or override the method in a new class.
◆ on_cursor_motion()
|
protectedvirtual |
This is a default handler for signal_cursor_motion()
This signal is emitted whenever the cursor (usually the mouse) is moved within the plot. x and y correspond to the new data coordinates. Currently this method does nothing, and users are encouraged to write their own signal handler or override the method in a new class.
- Parameters
-
x The X-value corresponding to the current cursor position y The Y-value corresponding to the current cursor position
◆ on_double_press()
|
protectedvirtual |
This is a default handler for signal_double_press()
This signal is emitted whenever a double mouse-click event is recorded within the plot box. Default response will be the resetting of the plot region to a range determined by the minima and maxima of the X- and Y- datasets
- Parameters
-
x X-plot-coordinate of the position where the double click event occurred. y Y-plot-coordinate of the position where the double click event occurred.
◆ on_pan()
|
protectedvirtual |
This is a default handler for signal_pan()
This signal is emitted whenever the cursor is moved within a pannable plot, with the Shift key and left mouse button pressed in. old_x and old_y correspond to the old data coordinates, before the motion, while new_x and new_y refer to the new data coordinates. Currently this method will cause the plot to move around in its box (panning). If this behavior is not desired, derive the class and implement your own on_pan method.
- Parameters
-
old_x The X-value corresponding to the previous cursor position old_y The Y-value corresponding to the previous cursor position new_x The X-value corresponding to the previous cursor position new_y The Y-value corresponding to the previous cursor position
- Returns
- a vector containing old_x, old_y, new_x and new_y, which may be different from the originally passed values!
- Since
- 2.2
◆ on_select_region()
|
protectedvirtual |
This is a default handler for signal_select_region()
This method passes the plot (data) coordinates of the selection box to set_region, in order to set the plotted range corresponding to the selection box. If this behavior is not desired, derive the class and implement your own on_select_region method.
- Parameters
-
xmin left X-coordinate xmax right X-coordinate ymin lower Y-coordinate ymax upper Y-coordinate
- Exceptions
-
Gtk::PLplot::Exception
◆ on_zoom_region()
|
protectedvirtual |
This is a default handler for signal_zoom_region()
This method passes the plot (data) coordinates corresponding to the position where the user produced a scroll event. Depending on the direction of the scroll movement, the region will be zoomed in or out. If this behavior is not desired, derive the class and implement your own on_zoom_region method.
- Parameters
-
x X-coordinate y Y-coordinate direction Movement direction
- Exceptions
-
Gtk::PLplot::Exception
- Since
- 2.2
◆ set_region()
| void Gtk::PLplot::RegionSelection::set_region | ( | double | xmin, |
| double | xmax, | ||
| double | ymin, | ||
| double | ymax | ||
| ) |
Changes the visible plotted region
Sets the axes range of the plotted box to the provided world coordinates.
- Parameters
-
xmin left X-coordinate xmax right X-coordinate ymin lower Y-coordinate ymax upper Y-coordinate
- Exceptions
-
Gtk::PLplot::Exception
◆ set_region_pannable()
| void Gtk::PLplot::RegionSelection::set_region_pannable | ( | bool | pannable = true | ) |
Sets whether plots can be panned within the plot by simultaneously clicking the left mouse button and the shift key
- Parameters
-
pannable pass trueif plotdata is pannable,falseif not
- Since
- 2.2
◆ set_region_selectable()
| void Gtk::PLplot::RegionSelection::set_region_selectable | ( | bool | selectable = true | ) |
Sets whether regions can be selected on the plot by dragging the mouse while the button is clicked in.
- Parameters
-
selectable pass trueif a region has to be selectable,falseif not
◆ set_region_selection_color()
| void Gtk::PLplot::RegionSelection::set_region_selection_color | ( | Gdk::RGBA | color | ) |
Sets the selection box color
- Parameters
-
color the new region selection box color
- Since
- 2.2
◆ set_region_selection_width()
| void Gtk::PLplot::RegionSelection::set_region_selection_width | ( | double | line_width | ) |
Sets the selection box line width
- Parameters
-
line_width the new region selection box line width
- Exceptions
-
Gtk::PLplot::Exception
- Since
- 2.2
◆ set_region_zoom_scale_factor()
| void Gtk::PLplot::RegionSelection::set_region_zoom_scale_factor | ( | double | scale_factor | ) |
Sets a new zoom scale factor
- Parameters
-
scale_factor the new zoom scale factor
- Exceptions
-
Gtk::PLplot::Exception
- Since
- 2.2
◆ set_region_zoomable()
| void Gtk::PLplot::RegionSelection::set_region_zoomable | ( | bool | zoomable = true | ) |
Sets whether regions can be selected on the plot by scrolling the mouse wheel (or trackpad)
- Parameters
-
zoomable pass trueif a region has to be zoomable,falseif not
- Since
- 2.2
◆ signal_cursor_enter()
|
inline |
signal_cursor_enter is emitted whenever the cursor enters within the plot
See default handler on_cursor_enter()
◆ signal_cursor_leave()
|
inline |
signal_cursor_leave is emitted whenever the cursor leaves the plot
See default handler on_cursor_leave()
◆ signal_cursor_motion()
|
inline |
signal_cursor_motion is emitted whenever the cursor is moved within the plot
See default handler on_cursor_motion()
◆ signal_double_press()
|
inline |
signal_double_press is emitted whenever a double-click event on the plot is recorded.
See default handler on_double_press()
◆ signal_pan()
|
inline |
signal_pan is emitted whenever the cursor is moved within the plot and Shift is pressed in.
See default handler on_pan()
◆ signal_select_region()
|
inline |
signal_select_region is emitted whenever a selection box is dragged across a plot
See default handler on_select_region()
◆ signal_zoom_region()
|
inline |
signal_zoom_region is emitted whenever a mouse scroll event on the plot is recorded.
See default handler on_zoom_region()
- Since
- 2.2
Friends And Related Symbol Documentation
◆ Canvas
|
friend |
Member Data Documentation
◆ _signal_cursor_enter
|
protected |
signal that will be emitted whenever the cursor (usually the mouse) enter.
◆ _signal_cursor_leave
|
protected |
signal that will be emitted whenever the cursor (usually the mouse) leave.
◆ _signal_cursor_motion
|
protected |
signal that will be emitted whenever the cursor (usually the mouse) is moved.
◆ _signal_double_press
|
protected |
signal that will emitted whenever a double mouse-click event was recorded within the plot box. Default response will be to reset the region to a range determined by the minima and maxima of the X- and Y- datasets.
◆ _signal_pan
|
protected |
signal that will be emitted whenever the cursor is moved within a pannable plot while the SHIFT key is pressed in and the left mouse button is pressed.
◆ _signal_select_region
|
protected |
signal that gets emitted whenever a new region was selected using the mouse pointer in Canvas::on_button_release_event()
◆ _signal_zoom_region
|
protected |
signal that gets emitted whenever one zooms in on the plot using the mouse scroll wheel in Canvas::on_scroll_event()
◆ cairo_range_x
|
protected |
the current range shown on the plot for the X-axis in Cairo coordinates
◆ cairo_range_y
|
protected |
the current range shown on the plot for the Y-axis in Cairo coordinates
◆ plot_data_range_x
|
protected |
the maximum range covered by the X-values of the datasets in PLplot coordinates (NOT world!!!)
◆ plot_data_range_y
|
protected |
the maximum range covered by the Y-values of the datasets in PLplot coordinates (NOT world!!!)
◆ plotted_range_x
|
protected |
the current range shown on the plot for the X-axis in PLplot coordinates (NOT world!!!)
◆ plotted_range_y
|
protected |
the current range shown on the plot for the Y-axis in PLplot coordinates (NOT world!!!)
◆ region_pannable
|
private |
true indicates that one can pan a plot around by simultaneously pressing Shift and the left mouse button while moving the mouse cursor around. false means not possible. The default is true
◆ region_selectable
|
private |
true indicates that a region on the plot can be selected by dragging a box with the mouse button pressed in when showing, or if double mouse button pressed event zooms out, false means not possible. The default is true
◆ region_selection_color
|
private |
color that will be used to draw the selection box
◆ region_selection_width
|
private |
width of the selection box frame
◆ region_zoom_scale_factor
|
private |
scale factor that will be used for scroll wheel based zooming
◆ region_zoomable
|
private |
true indicates that one can zoom in on a region on the plot by using the mouse scroll wheel (or trackpad), false means not possible. The default is true