a class for two-dimensional plots More...
#include <gtkmm-plplot/plot2d.h>
Public Member Functions | |
| Plot2D (const Glib::ustring &axis_title_x="X-axis", const Glib::ustring &axis_title_y="Y-axis", const Glib::ustring &plot_title="", const double plot_width_norm=1.0, const double plot_height_norm=1.0, const double plot_offset_horizontal_norm=0.0, const double plot_offset_vertical_norm=0.0) | |
| Plot2D (PlotData2D &data, const Glib::ustring &axis_title_x="X-axis", const Glib::ustring &axis_title_y="Y-axis", const Glib::ustring &plot_title="", const double plot_width_norm=1.0, const double plot_height_norm=1.0, const double plot_offset_horizontal_norm=0.0, const double plot_offset_vertical_norm=0.0) | |
| virtual | ~Plot2D () |
| virtual void | add_data (PlotData2D &data) |
| virtual void | remove_data (unsigned int plot_data_index) override |
| virtual void | remove_data (PlotData &plot_data_member) override |
| virtual void | add_object (PlotObject2D &object) |
| virtual void | draw_plot (const Cairo::RefPtr< Cairo::Context > &cr, const int width, const int height) override |
| void | set_box_style (BoxStyle style=BOX_TICKS_TICK_LABELS) |
| BoxStyle | get_box_style () |
| void | set_axis_logarithmic_x (bool log10=true) |
| void | set_axis_logarithmic_y (bool log10=true) |
| bool | get_axis_logarithmic_x () |
| bool | get_axis_logarithmic_y () |
| void | config_time_x (double scale, const Glib::DateTime &time) |
| void | set_axis_time_format_x (Glib::ustring time_format) |
| Glib::ustring | get_axis_time_format_x () |
 Public Member Functions inherited from Gtk::PLplot::Plot Public Member Functions inherited from Gtk::PLplot::Plot | |
| virtual | ~Plot () |
| virtual void | remove_object (unsigned int plot_object_index) |
| virtual void | remove_object (PlotObject &plot_object_member) |
| virtual PlotData * | get_data (unsigned int data_index=0) final |
| void | set_axis_title_x (Glib::ustring title) |
| void | set_axis_title_y (Glib::ustring title) |
| Glib::ustring | get_axis_title_x () |
| Glib::ustring | get_axis_title_y () |
| void | set_plot_title (Glib::ustring title) |
| Glib::ustring | get_plot_title () |
| void | show () |
| void | hide () |
| bool | is_showing () const |
| Gdk::RGBA | get_background_color () |
| void | set_background_color (Gdk::RGBA color) |
| Gdk::RGBA | get_axes_color () |
| void | set_axes_color (Gdk::RGBA color) |
| Gdk::RGBA | get_titles_color () |
| void | set_titles_color (Gdk::RGBA color) |
| sigc::signal< void(void)> | signal_changed () |
| sigc::signal< void(PlotData *)> | signal_data_added () |
| sigc::signal< void(PlotData *)> | signal_data_removed () |
| sigc::signal< void(PlotObject *)> | signal_object_added () |
| sigc::signal< void(PlotObject *)> | signal_object_removed () |
| Public Member Functions inherited from Gtk::PLplot::Object | |
| virtual void | set_manage () |
| Public Member Functions inherited from Gtk::PLplot::Legend | |
| void | set_legend_background_color (Gdk::RGBA legend_background_color) |
| Gdk::RGBA | get_legend_background_color () |
| void | set_legend_bounding_box_color (Gdk::RGBA legend_bounding_box_color) |
| Gdk::RGBA | get_legend_bounding_box_color () |
| void | set_legend_position (double legend_pos_x, double legend_pos_y) |
| void | get_legend_position (double &legend_pos_x, double &legend_pos_y) |
| void | set_legend_corner_position (LegendCornerPosition legend_corner_position) |
| LegendCornerPosition | get_legend_corner_position () |
| void | show_legend () |
| void | hide_legend () |
| bool | is_showing_legend () |
| Public Member Functions inherited from Gtk::PLplot::RegionSelection | |
| virtual | ~RegionSelection () |
| void | set_region (double xmin, double xmax, double ymin, double ymax) |
| void | get_region (double &xmin, double &xmax, double &ymin, double &ymax) |
| bool | get_region_selectable () |
| void | set_region_selectable (bool selectable=true) |
| bool | get_region_zoomable () |
| void | set_region_zoomable (bool zoomable=true) |
| double | get_region_zoom_scale_factor () |
| void | set_region_zoom_scale_factor (double scale_factor) |
| Gdk::RGBA | get_region_selection_color () |
| void | set_region_selection_color (Gdk::RGBA color) |
| double | get_region_selection_width () |
| void | set_region_selection_width (double line_width) |
| bool | get_region_pannable () |
| void | set_region_pannable (bool pannable=true) |
| sigc::signal< void(double, double, double, double)> | signal_select_region () |
| sigc::signal< void(double, double)> | signal_cursor_motion () |
| sigc::signal< void(double, double)> | signal_cursor_enter () |
| sigc::signal< void(void)> | signal_cursor_leave () |
| sigc::signal< std::vector< double >(double, double, double, double)> | signal_pan () |
| sigc::signal< void(double, double)> | signal_double_press () |
| sigc::signal< void(double, double, GdkScrollDirection)> | signal_zoom_region () |
Protected Member Functions | |
| virtual void | plot_data_modified () override |
a method that will update the _range variables when datasets are added, modified or removed. | |
| virtual void | coordinate_transform_world_to_plplot (double x_old, double y_old, double &x_new, double &y_new) override |
| virtual void | coordinate_transform_plplot_to_world (double x_old, double y_old, double &x_new, double &y_new) override |
| Protected Member Functions inherited from Gtk::PLplot::Plot | |
| virtual void | on_changed () |
| virtual void | on_data_added (PlotData *new_data) |
| virtual void | on_data_removed (PlotData *removed_data) |
| virtual void | on_object_added (PlotObject *new_object) |
| virtual void | on_object_removed (PlotObject *removed_object) |
| virtual void | draw_plot_init (const Cairo::RefPtr< Cairo::Context > &cr, const int width, const int height) final |
| Plot (const Glib::ustring &axis_title_x, const Glib::ustring &axis_title_y, const Glib::ustring &plot_title, const double plot_width_norm, const double plot_height_norm, const double plot_offset_horizontal_norm, const double plot_offset_vertical_norm) | |
| Protected Member Functions inherited from Gtk::PLplot::Object | |
| Object () | |
| Protected Member Functions inherited from Gtk::PLplot::Legend | |
| Legend (const Legend &legend)=default | |
| Legend (LegendCornerPosition legend_corner_position=LegendCornerPosition::TOP_RIGHT, double legend_pos_x=0.0, double legend_pos_y=0.0, Gdk::RGBA legend_background_color=Gdk::RGBA("White"), Gdk::RGBA legend_bounding_box_color=Gdk::RGBA("Black")) | |
| virtual | ~Legend () |
| virtual void | draw_legend (const Cairo::RefPtr< Cairo::Context > &cr, std::vector< PlotData * > &plot_data, plstream *pls) |
| Protected Member Functions inherited from Gtk::PLplot::RegionSelection | |
| virtual void | coordinate_transform_plplot_to_cairo (double x_pl, double y_pl, double &x_cr, double &y_cr) final |
| virtual void | coordinate_transform_cairo_to_plplot (double x_cr, double y_cr, double &x_pl, double &y_pl) final |
| virtual void | coordinate_transform_world_to_cairo (double x_wr, double y_wr, double &x_cr, double &y_cr) final |
| virtual void | coordinate_transform_cairo_to_world (double x_cr, double y_cr, double &x_wr, double &y_wr) final |
| virtual void | on_select_region (double xmin, double xmax, double ymin, double ymax) |
| virtual void | on_zoom_region (double x, double y, GdkScrollDirection direction) |
| virtual void | on_cursor_motion (double x, double y) |
| virtual void | on_cursor_enter (double x, double y) |
| virtual void | on_cursor_leave () |
| virtual std::vector< double > | on_pan (double old_x, double old_y, double new_x, double new_y) |
| virtual void | on_double_press (double x, double y) |
| RegionSelection () | |
| RegionSelection (const RegionSelection ®ion_selection)=default | |
Static Protected Member Functions | |
| static void | coordinate_transform_world_to_plplot (double x_old, double y_old, double *x_new, double *y_new, void *object) |
| static void | coordinate_transform_plplot_to_world (double x_old, double y_old, double *x_new, double *y_new, void *object) |
| Static Protected Member Functions inherited from Gtk::PLplot::RegionSelection | |
| static void | ensure_valid_range (double &val0, double &val1) |
| internal function that ensures valid ranges are always plotted, mostly avoiding case where for either x or y, data min is equal to data max. | |
Private Member Functions | |
| Plot2D ()=delete | |
| no default constructor | |
| Plot2D (const Plot2D &)=delete | |
| no default copy constructor | |
| Plot2D & | operator= (const Plot2D &)=delete |
| no assignment operator | |
Private Attributes | |
| bool | log10_x |
true means X-axis logarithmic axis, false means linear | |
| bool | log10_y |
true means Y-axis logarithmic axis, false means linear | |
| BoxStyle | box_style |
| the currently used box style to draw the box, axes and grid | |
| Glib::ustring | time_format |
| the time format to use date / time in the X-axis | |
| double | time_scale = 1. / 86400 |
| the time scale in fraction of day when converting from date/time to double | |
| Glib::DateTime | time_start = Glib::DateTime::create_utc(1970,1,1,0,0,0) |
| the time start when converting from date/time to double | |
Friends | |
| class | Canvas |
Additional Inherited Members | |
| Protected Attributes inherited from Gtk::PLplot::Plot | |
| std::vector< PlotData * > | plot_data |
| vector that contains pointers to the PlotData datasets | |
| std::vector< PlotObject * > | plot_objects |
| vector that contains pointers to the PlotObject datasets | |
| Glib::ustring | axis_title_x |
| X-axis title. | |
| Glib::ustring | axis_title_y |
| Y-axis title. | |
| Glib::ustring | plot_title |
| Plot title. | |
| plstream * | pls |
the plstream object that will ensure the connection with PLplot | |
| int | canvas_width |
| the width of the canvas in Cairo units | |
| int | canvas_height |
| the height of the canvas in Cairo units | |
| int | plot_offset_x |
| the offset of the plot with respect to the top left corner of the canvas, measured along the horizontal (X-) axis in Cairo units | |
| int | plot_offset_y |
| the offset of the plot with respect to the top left corner of the canvas, measured along the vertical (Y-) axis in Cairo units | |
| int | plot_width |
| the current width of the plot in Cairo units | |
| int | plot_height |
| the current height of the plot in Cairo units | |
| bool | shown |
true means the plot is currently visible, false means it is not plotted | |
| Gdk::RGBA | background_color |
| the currently used background color of the plot (default = fully transparent white, meaning that the background will be determined by the canvas) | |
| const double | plot_width_norm |
| the normalized plot width, calculated relative to the canvas width | |
| const double | plot_height_norm |
| the normalized plot height, calculated relative to the canvas height | |
| const double | plot_offset_horizontal_norm |
| the normalized horizontal offset from the canvas top left corner, calculated relative to the canvas width | |
| const double | plot_offset_vertical_norm |
| the normalized vertical offset from the canvas top left corner, calculated relative to the canvas height | |
| Gdk::RGBA | axes_color |
| the currently used color to draw the axes, the box and gridlines. Default is opaque black | |
| Gdk::RGBA | titles_color |
| the currently used color to draw the axes and plot titles. Default is opaque black | |
| sigc::signal< void(void)> | _signal_changed |
| signal that gets emitted whenever any of the plot parameters, or any of the contained PlotData datasets is changed. | |
| sigc::signal< void(PlotData *)> | _signal_data_added |
| signal emitted whenever a PlotData dataset is added to the plot | |
| sigc::signal< void(PlotData *)> | _signal_data_removed |
| signal emitted whenever data is removed from the plot. | |
| sigc::signal< void(PlotObject *)> | _signal_object_added |
| signal emitted whenever a PlotObject is added to the plot | |
| sigc::signal< void(PlotObject *)> | _signal_object_removed |
| signal emitted whenever a PlotObject is removed from the plot. | |
| Protected Attributes inherited from Gtk::PLplot::RegionSelection | |
| double | cairo_range_x [2] |
| the current range shown on the plot for the X-axis in Cairo coordinates | |
| double | cairo_range_y [2] |
| the current range shown on the plot for the Y-axis in Cairo coordinates | |
| double | plotted_range_x [2] |
| the current range shown on the plot for the X-axis in PLplot coordinates (NOT world!!!) | |
| double | plotted_range_y [2] |
| the current range shown on the plot for the Y-axis in PLplot coordinates (NOT world!!!) | |
| double | plot_data_range_x [2] |
| the maximum range covered by the X-values of the datasets in PLplot coordinates (NOT world!!!) | |
| double | plot_data_range_y [2] |
| the maximum range covered by the Y-values of the datasets in PLplot coordinates (NOT world!!!) | |
| sigc::signal< void(double, double, double, double)> | _signal_select_region |
| signal that gets emitted whenever a new region was selected using the mouse pointer in Canvas::on_button_release_event() | |
| sigc::signal< void(double, double, GdkScrollDirection)> | _signal_zoom_region |
| signal that gets emitted whenever one zooms in on the plot using the mouse scroll wheel in Canvas::on_scroll_event() | |
| sigc::signal< void(double, double)> | _signal_cursor_motion |
| signal that will be emitted whenever the cursor (usually the mouse) is moved. | |
| sigc::signal< void(double, double)> | _signal_cursor_enter |
| signal that will be emitted whenever the cursor (usually the mouse) enter. | |
| sigc::signal< void(void)> | _signal_cursor_leave |
| signal that will be emitted whenever the cursor (usually the mouse) leave. | |
| sigc::signal< std::vector< double >(double, double, double, double)> | _signal_pan |
| signal that will be emitted whenever the cursor is moved within a pannable plot while the SHIFT key is pressed in and the left mouse button is pressed. | |
| sigc::signal< void(double, double)> | _signal_double_press |
| signal that will emitted whenever a double mouse-click event was recorded within the plot box. Default response will be to reset the region to a range determined by the minima and maxima of the X- and Y- datasets. | |
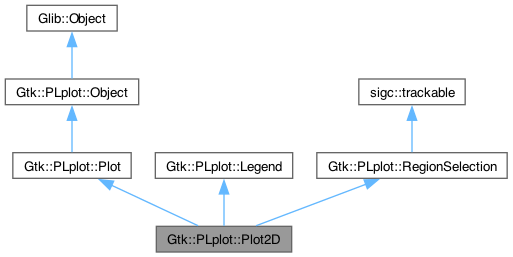
Detailed Description
a class for two-dimensional plots
A class for conventional two-dimensional plots. New plots can be created with either none or a single dataset. Afterwards, additional datasets may be added using the add_data() method. Several properties may be set such as the axes and plot titles, type of scaling (linear or logarithmic). Important is that whenever a property is changed, signal_changed() is emitted, which will eventually be picked up by the canvas that will hold the plot. For more information, the reader is referred to the examples Example 1: Plot data properties and zooming, Example 2: Logarithmic axes and box styles, Example 3: Adding, removing, showing and hiding plots, Example 4: Displaying multiple plots on a single canvas and Example 5: Mixing plot lines and symbols plus adding datapoints.
Constructor & Destructor Documentation
◆ Plot2D() [1/4]
|
privatedelete |
no default constructor
◆ Plot2D() [2/4]
|
privatedelete |
no default copy constructor
◆ Plot2D() [3/4]
| Gtk::PLplot::Plot2D::Plot2D | ( | const Glib::ustring & | axis_title_x = "X-axis", |
| const Glib::ustring & | axis_title_y = "Y-axis", |
||
| const Glib::ustring & | plot_title = "", |
||
| const double | plot_width_norm = 1.0, |
||
| const double | plot_height_norm = 1.0, |
||
| const double | plot_offset_horizontal_norm = 0.0, |
||
| const double | plot_offset_vertical_norm = 0.0 |
||
| ) |
Constructor
This constructor produces an empty PlotData2D plot. Add data to it using add_data. Optionally, the constructor takes additional arguments to set the axes and plot titles, as well as normalized coordinates that will determine the position and dimensions of the plot within the canvas. The default corresponds to the plot taking up the full c
- Parameters
-
axis_title_x X-axis title axis_title_y Y-axis title plot_title plot title plot_width_norm the normalized plot width, calculated relative to the canvas width plot_height_norm the normalized plot height, calculated relative to the canvas height plot_offset_horizontal_norm the normalized horizontal offset from the canvas top left corner, calculated relative to the canvas width plot_offset_vertical_norm the normalized vertical offset from the canvas top left corner, calculated relative to the canvas height
◆ Plot2D() [4/4]
| Gtk::PLplot::Plot2D::Plot2D | ( | PlotData2D & | data, |
| const Glib::ustring & | axis_title_x = "X-axis", |
||
| const Glib::ustring & | axis_title_y = "Y-axis", |
||
| const Glib::ustring & | plot_title = "", |
||
| const double | plot_width_norm = 1.0, |
||
| const double | plot_height_norm = 1.0, |
||
| const double | plot_offset_horizontal_norm = 0.0, |
||
| const double | plot_offset_vertical_norm = 0.0 |
||
| ) |
Constructor
This constructor takes an existing PlotData2D dataset to construct a plot. Optionally, the constructor takes additional arguments to set the axes and plot titles, as well as normalized coordinates that will determine the position and dimensions of the plot within the canvas. The default corresponds to the plot taking up the full c
- Parameters
-
data a PlotData2D object containing a plot dataset axis_title_x X-axis title axis_title_y Y-axis title plot_title plot title plot_width_norm the normalized plot width, calculated relative to the canvas width plot_height_norm the normalized plot height, calculated relative to the canvas height plot_offset_horizontal_norm the normalized horizontal offset from the canvas top left corner, calculated relative to the canvas width plot_offset_vertical_norm the normalized vertical offset from the canvas top left corner, calculated relative to the canvas height
◆ ~Plot2D()
|
virtual |
Destructor
Member Function Documentation
◆ add_data()
|
virtual |
Add a single PlotData2D dataset to the plot
- Parameters
-
data dataset to be added to the plot
- Exceptions
-
Gtk::PLplot::Exception
◆ add_object()
|
virtual |
Add a single PlotObject2D object to the plot
- Parameters
-
object Object to be added to the plot
- Exceptions
-
Gtk::PLplot::Exception
◆ config_time_x()
| void Gtk::PLplot::Plot2D::config_time_x | ( | double | scale, |
| const Glib::DateTime & | time | ||
| ) |
Configure transformation between continuous and broken-down time (and vice versa) of the X-axis
- Parameters
-
scale the time scale in fraction of day when converting from date/time to double.. time the time start when converting from date/time to double.
◆ coordinate_transform_plplot_to_world() [1/2]
|
overrideprotectedvirtual |
This method takes care of coordinate transformations when using non-linear axes
When a plot has logarithmic axes or polar plot style, PLplot requires the user to transform the dataset into the linear cartesian coordinate system which it uses internally. This method is a wrapper around the static function with the same name.
- Parameters
-
x_old the xPLplot coordinate to be transformedy_old the yPLplot coordinate to be transformedx_new the new xworld coordinatey_new the new yworld coordinate
Reimplemented from Gtk::PLplot::RegionSelection.
◆ coordinate_transform_plplot_to_world() [2/2]
|
staticprotected |
This static method takes care of coordinate transformations when using non-linear axes
When a plot has logarithmic axes or polar plot style, PLplot requires the user to transform the dataset into the linear cartesian coordinate system which it uses internally. The reason that this is static method is due to PLplot expecting a C function...
◆ coordinate_transform_world_to_plplot() [1/2]
|
overrideprotectedvirtual |
This method takes care of coordinate transformations when using non-linear axes
When a plot has logarithmic axes or polar plot style, PLplot requires the user to transform the dataset into the linear cartesian coordinate system which it uses internally. This method is a wrapper around the static function with the same name.
- Parameters
-
x_old the xworld coordinate to be transformedy_old the yworld coordinate to be transformedx_new the new xPLplot coordinatey_new the new yPLplot coordinate
Reimplemented from Gtk::PLplot::RegionSelection.
◆ coordinate_transform_world_to_plplot() [2/2]
|
staticprotected |
This static method takes care of coordinate transformations when using non-linear axes
When a plot has logarithmic axes or polar plot style, PLplot requires the user to transform the dataset into the linear cartesian coordinate system which it uses internally. The reason that this is static method is due to PLplot expecting a C function...
◆ draw_plot()
|
overridevirtual |
Method to draw the plot with all of its datasets
This method is virtual allowing inheriting classes to implement their own method with the same signature.
- Parameters
-
cr the cairo context to draw to. width the width of the Canvas widget height the height of the Canvas widget
Implements Gtk::PLplot::Plot.
◆ get_axis_logarithmic_x()
| bool Gtk::PLplot::Plot2D::get_axis_logarithmic_x | ( | ) |
Get the current scaling of the X-axis
- Returns
trueindicates logarithmic scaling,falselinear scaling.
◆ get_axis_logarithmic_y()
| bool Gtk::PLplot::Plot2D::get_axis_logarithmic_y | ( | ) |
Get the current scaling of the Y-axis
- Returns
trueindicates logarithmic scaling,falselinear scaling.
◆ get_axis_time_format_x()
| Glib::ustring Gtk::PLplot::Plot2D::get_axis_time_format_x | ( | ) |
Get the current time format of the X-axis
- Returns
- the current time format of the X-axis.
◆ get_box_style()
| BoxStyle Gtk::PLplot::Plot2D::get_box_style | ( | ) |
Get the box style
- Returns
- the currently selected box style
◆ operator=()
◆ plot_data_modified()
|
overrideprotectedvirtual |
a method that will update the _range variables when datasets are added, modified or removed.
Implements Gtk::PLplot::Plot.
◆ remove_data() [1/2]
|
overridevirtual |
Remove a single dataset from the plot
- Parameters
-
plot_data_member pointer to the plotdata in the plot_datavector
- Exceptions
-
Gtk::PLplot::Exception
Reimplemented from Gtk::PLplot::Plot.
◆ remove_data() [2/2]
|
overridevirtual |
Remove a single dataset from the plot
- Parameters
-
plot_data_index index of the plotdata in the plot_datavector
- Exceptions
-
Gtk::PLplot::Exception
Reimplemented from Gtk::PLplot::Plot.
◆ set_axis_logarithmic_x()
| void Gtk::PLplot::Plot2D::set_axis_logarithmic_x | ( | bool | log10 = true | ) |
Sets the scaling of the X-axis to logarithmic
Before calling this method, the (default) scaling is linear. The function will check if the X-values allow for a logarithmic axis. If not, an exception will be thrown.
- Parameters
-
log10 truesets scaling to logarithmic,falseto linear.
- Exceptions
-
Gtk::PLplot::Exception
◆ set_axis_logarithmic_y()
| void Gtk::PLplot::Plot2D::set_axis_logarithmic_y | ( | bool | log10 = true | ) |
Sets the scaling of the Y-axis to logarithmic
Before calling this method, the (default) scaling is linear. The function will check if the Y-values allow for a logarithmic axis. If not, an exception will be thrown.
- Parameters
-
log10 truesets scaling to logarithmic,falseto linear.
- Exceptions
-
Gtk::PLplot::Exception
◆ set_axis_time_format_x()
| void Gtk::PLplot::Plot2D::set_axis_time_format_x | ( | Glib::ustring | time_format | ) |
Sets the time format of the X-axis to logarithmic
Before calling this method, the (default) time format is not set. When you call this function, the X-axis will interpret the X data as date / time The format is based on the C strftime function
- Parameters
-
time_format the new time format.
◆ set_box_style()
| void Gtk::PLplot::Plot2D::set_box_style | ( | BoxStyle | style = BOX_TICKS_TICK_LABELS | ) |
Set the box style
- Parameters
-
style the new box style (default is BOX_TICKS_TICK_LABELS)
Friends And Related Symbol Documentation
◆ Canvas
|
friend |
Member Data Documentation
◆ box_style
|
private |
the currently used box style to draw the box, axes and grid
◆ log10_x
|
private |
true means X-axis logarithmic axis, false means linear
◆ log10_y
|
private |
true means Y-axis logarithmic axis, false means linear
◆ time_format
|
private |
the time format to use date / time in the X-axis
◆ time_scale
|
private |
the time scale in fraction of day when converting from date/time to double
◆ time_start
|
private |
the time start when converting from date/time to double