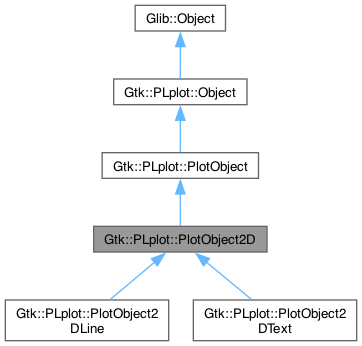
the abstract base class that will hold a single plot object and its properties that can be added to a plot containing 2D data, such as Plot2D, PlotContour, PlotPolar and PlotHistogram
More...
#include <gtkmm-plplot/plotobject2d.h>
|
| Gdk::RGBA | color |
| | The color the dataset will be drawn in.
|
| |
| sigc::signal< void(void)> | _signal_changed |
| | signal that gets emitted whenever any of the plot object properties is changed.
|
| |
the abstract base class that will hold a single plot object and its properties that can be added to a plot containing 2D data, such as Plot2D, PlotContour, PlotPolar and PlotHistogram
The base class that all other PlotObject classes ultimately derive from. Examples are PlotLine2D and PlotText2D
◆ PlotObject2D() [1/3]
| Gtk::PLplot::PlotObject2D::PlotObject2D |
( |
| ) |
|
|
privatedelete |
◆ PlotObject2D() [2/3]
| Gtk::PLplot::PlotObject2D::PlotObject2D |
( |
const PlotObject2D & |
source | ) |
|
|
privatedelete |
no default copy constructor;
◆ PlotObject2D() [3/3]
| Gtk::PLplot::PlotObject2D::PlotObject2D |
( |
Gdk::RGBA |
color | ) |
|
|
protected |
Constructor
This constructor initializes a new PlotObject2D instance, by setting the properties that will determine its appearance when rendered onto a plot
- Parameters
-
◆ ~PlotObject2D()
| virtual Gtk::PLplot::PlotObject2D::~PlotObject2D |
( |
| ) |
|
|
virtual |
◆ get_color()
| Gdk::RGBA Gtk::PLplot::PlotObject2D::get_color |
( |
| ) |
|
Get the current dataset color
- Returns
- the current dataset color
◆ is_logarithmic_x_compatible()
| virtual bool Gtk::PLplot::PlotObject2D::is_logarithmic_x_compatible |
( |
| ) |
|
|
pure virtual |
◆ is_logarithmic_y_compatible()
| virtual bool Gtk::PLplot::PlotObject2D::is_logarithmic_y_compatible |
( |
| ) |
|
|
pure virtual |
◆ operator=()
◆ set_color()
| void Gtk::PLplot::PlotObject2D::set_color |
( |
Gdk::RGBA |
color | ) |
|
Changes the color of the dataset
- Parameters
-
| color | The new dataset color |
◆ color
| Gdk::RGBA Gtk::PLplot::PlotObject2D::color |
|
protected |
The color the dataset will be drawn in.
 Public Member Functions inherited from Gtk::PLplot::PlotObject